HelioPeak
for PVOutput
Track your solar panel production with beautiful charts and detailed statistics. Reads directly from PVOutput.org, no intermediary server, no data manipulation.

for PVOutput
Track your solar panel production with beautiful charts and detailed statistics. Reads directly from PVOutput.org, no intermediary server, no data manipulation.
Designed for iPad with sidebar navigation, an Inspector panel, and a full-year heatmap. Runs natively on Apple Silicon Macs — one App Store purchase, three platforms.
A complete solar monitoring companion for PVOutput users.
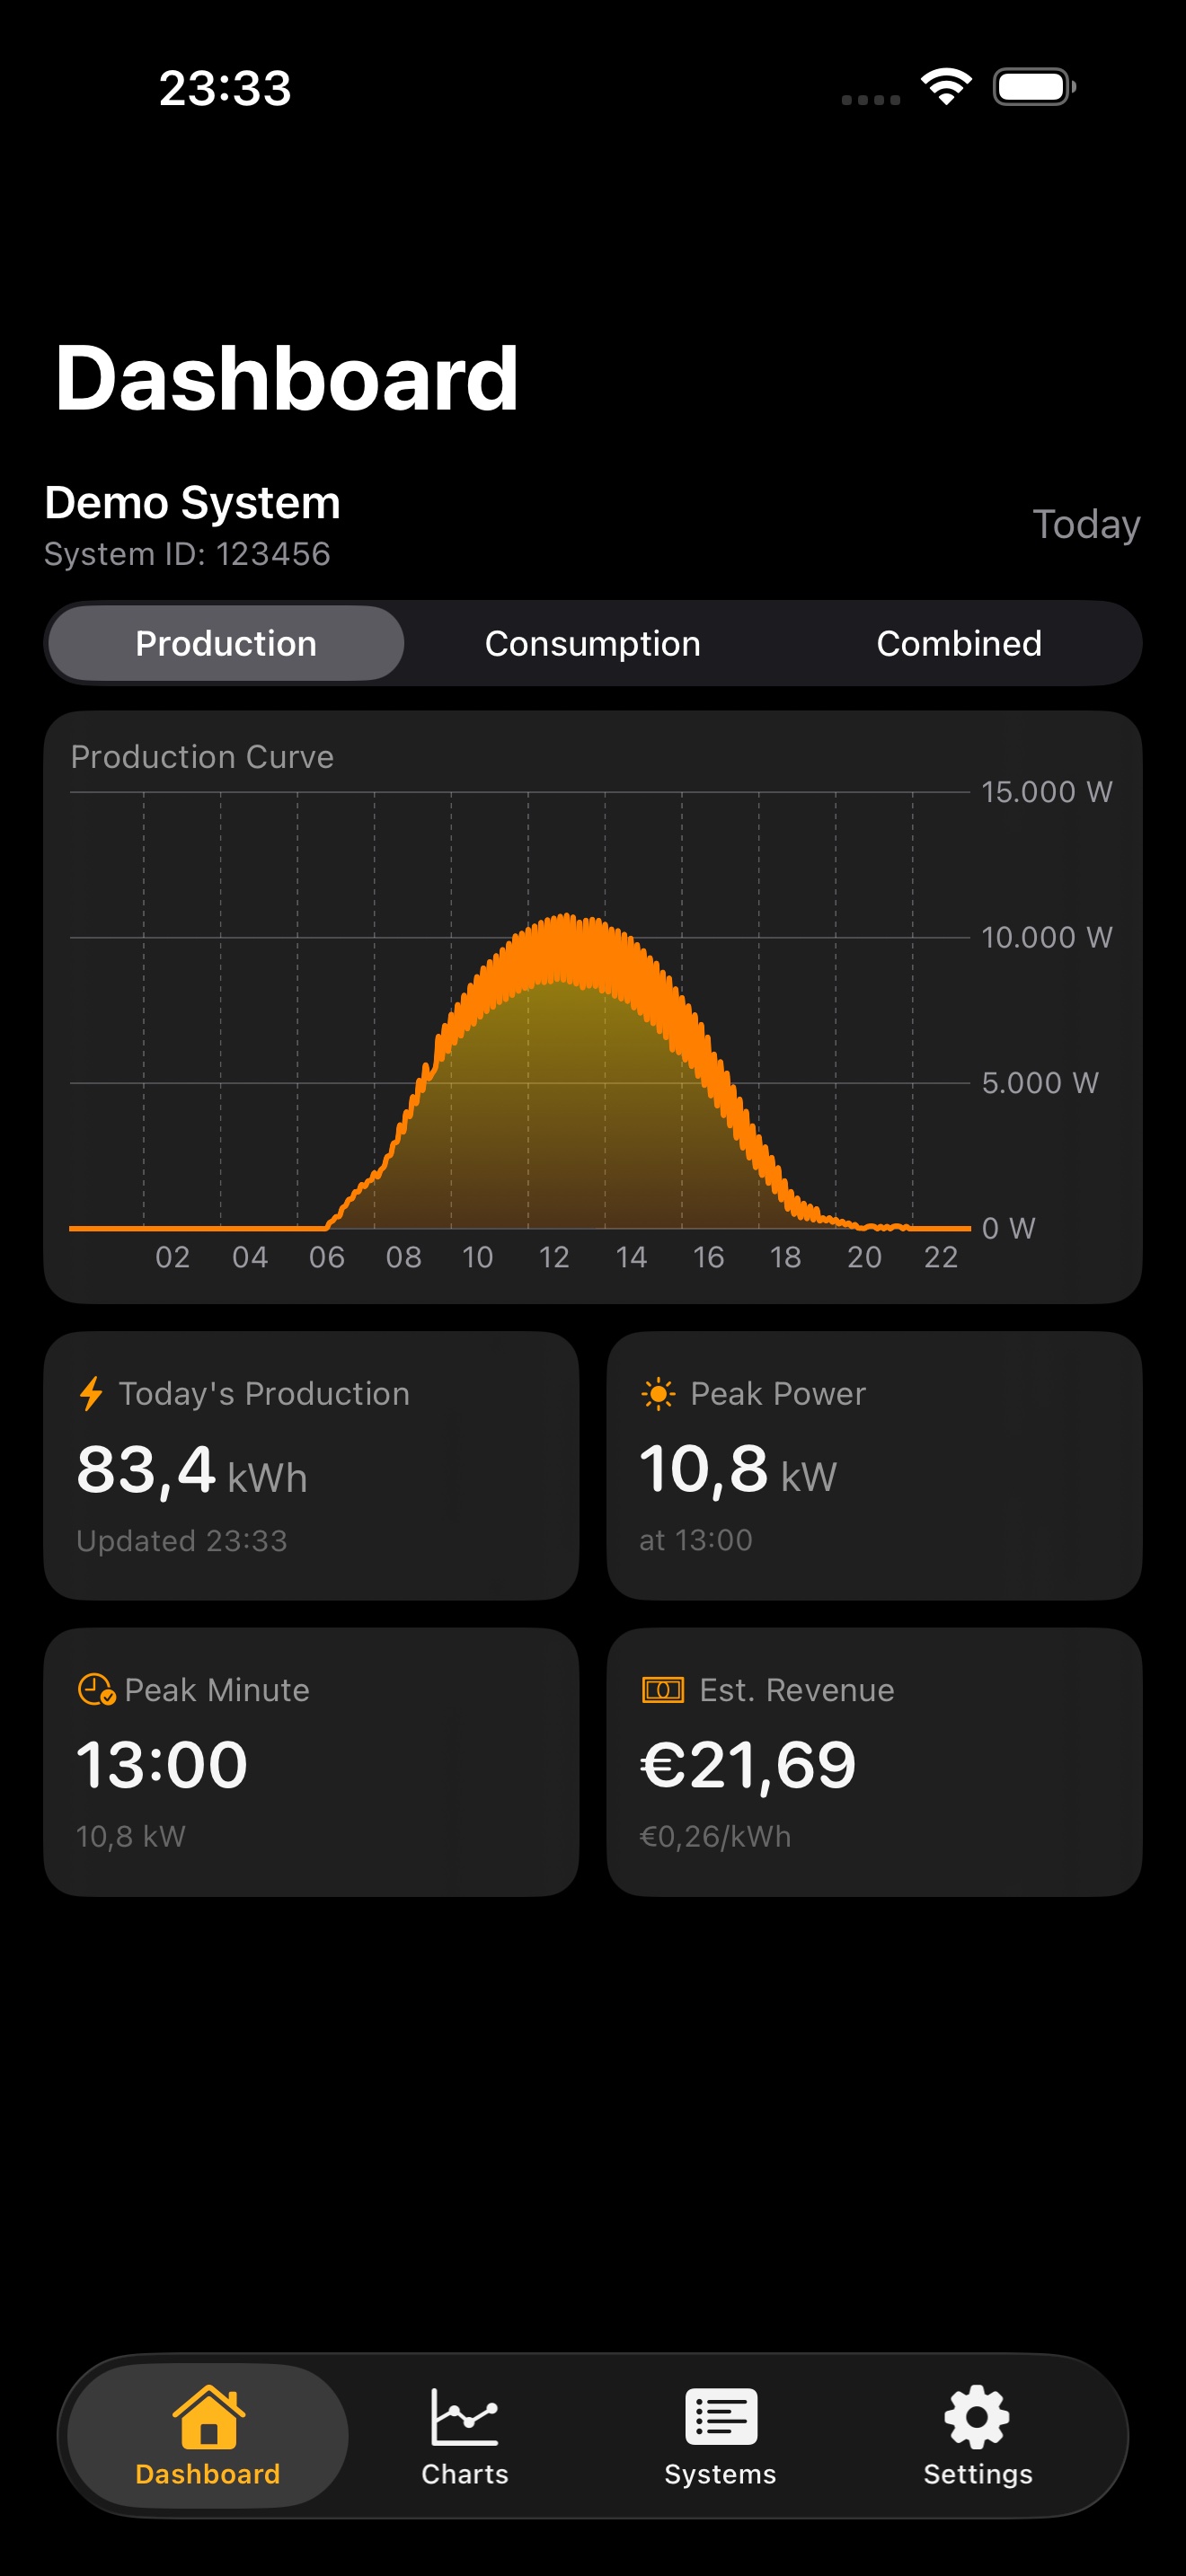
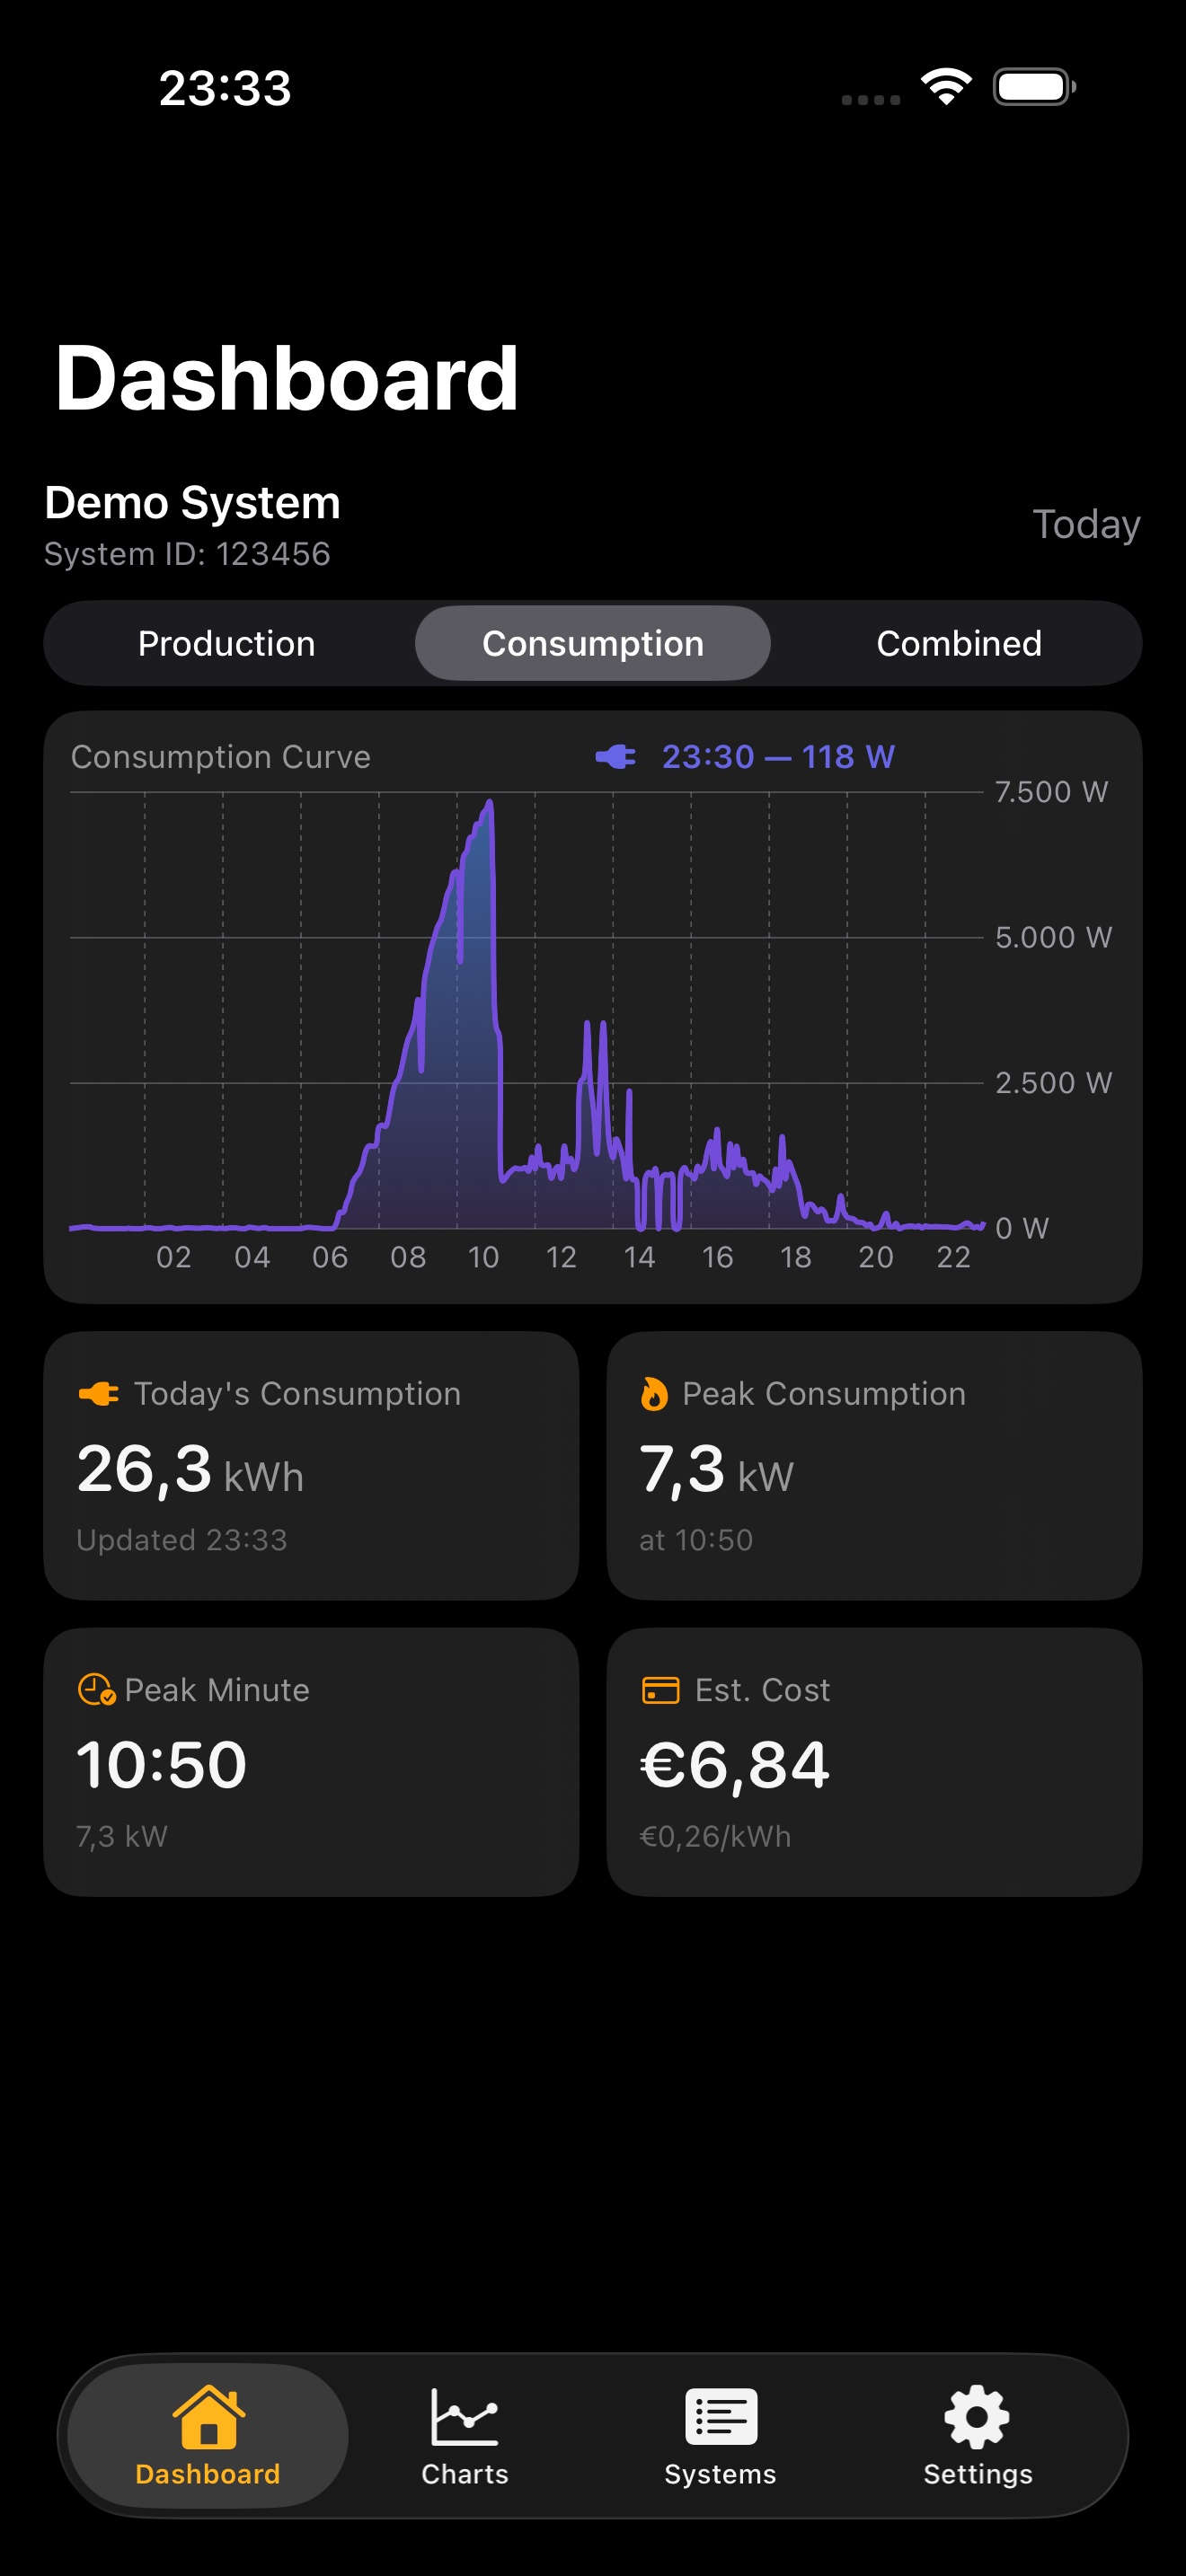
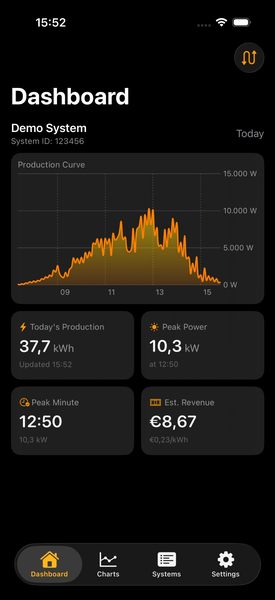
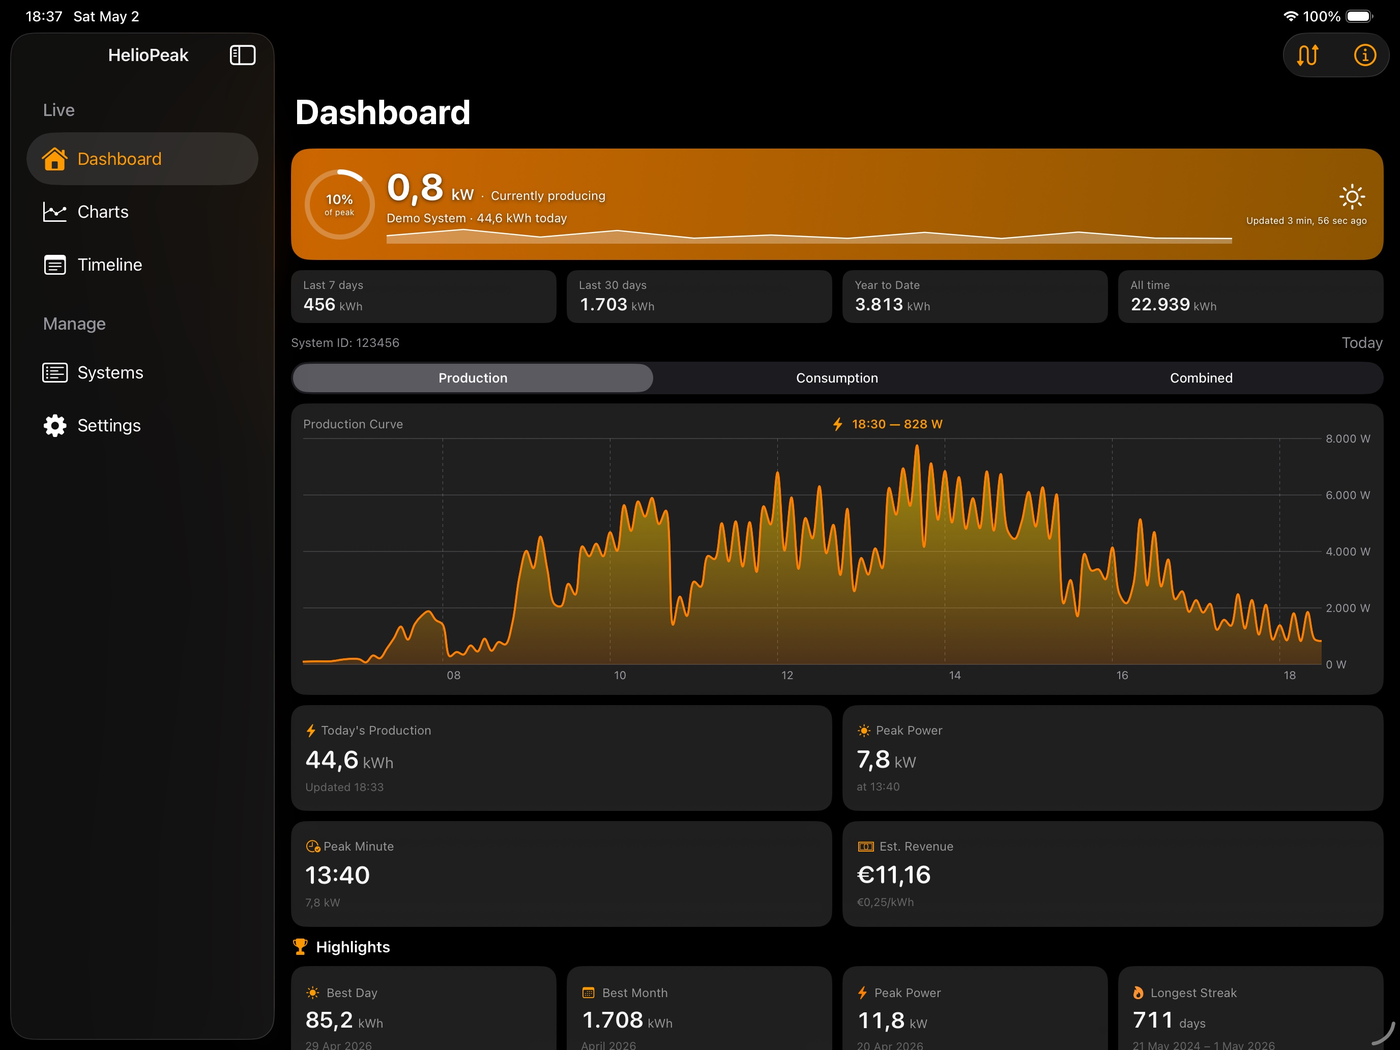
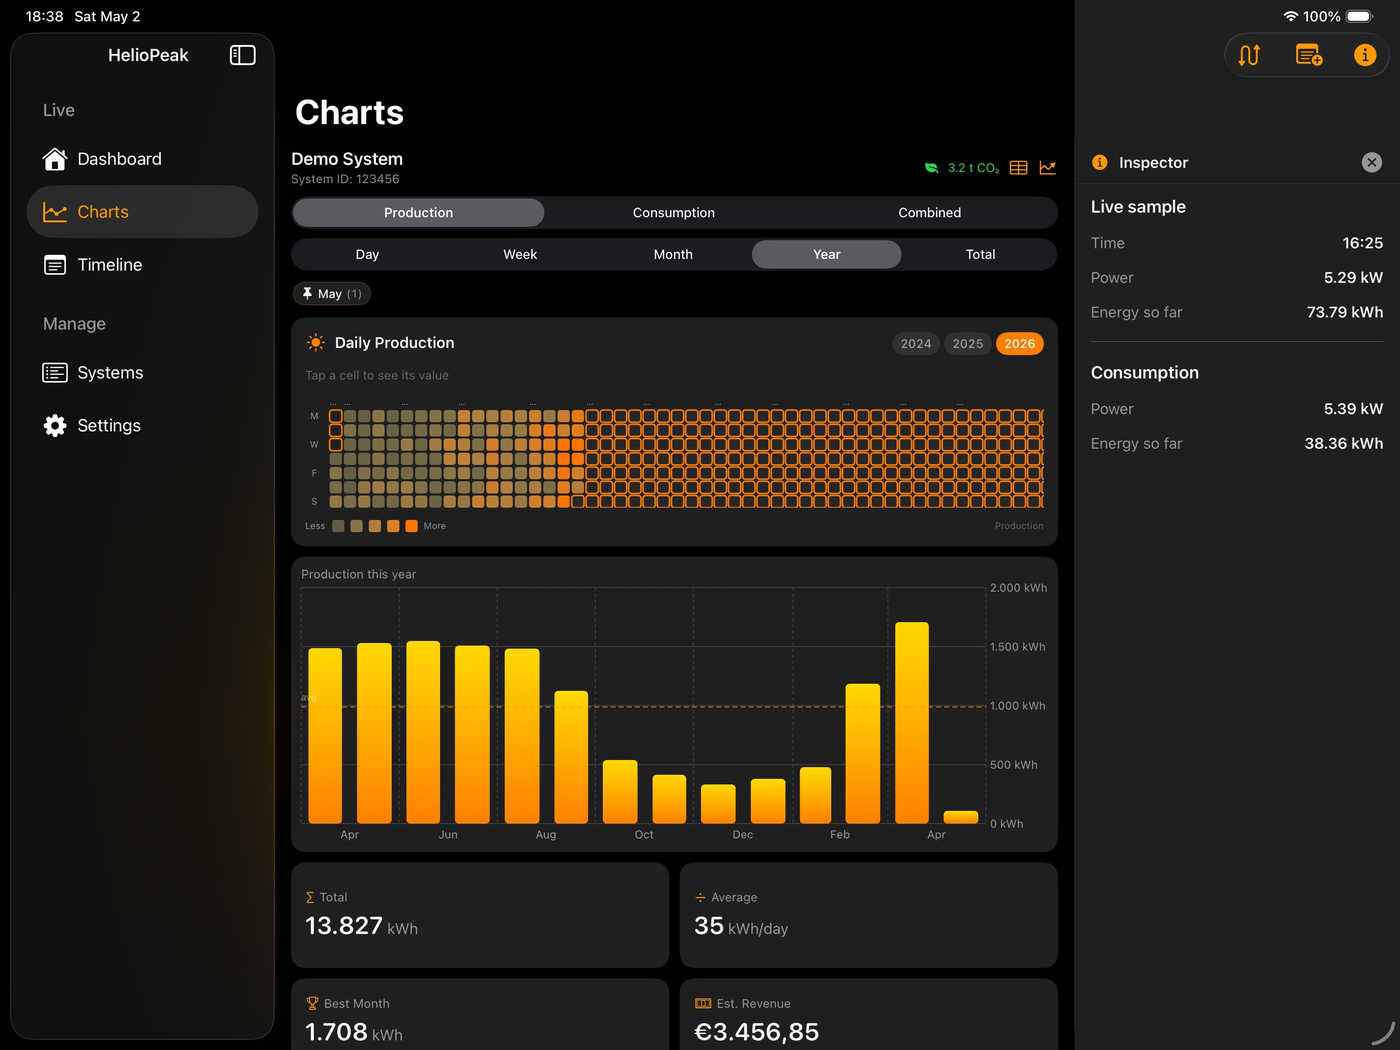
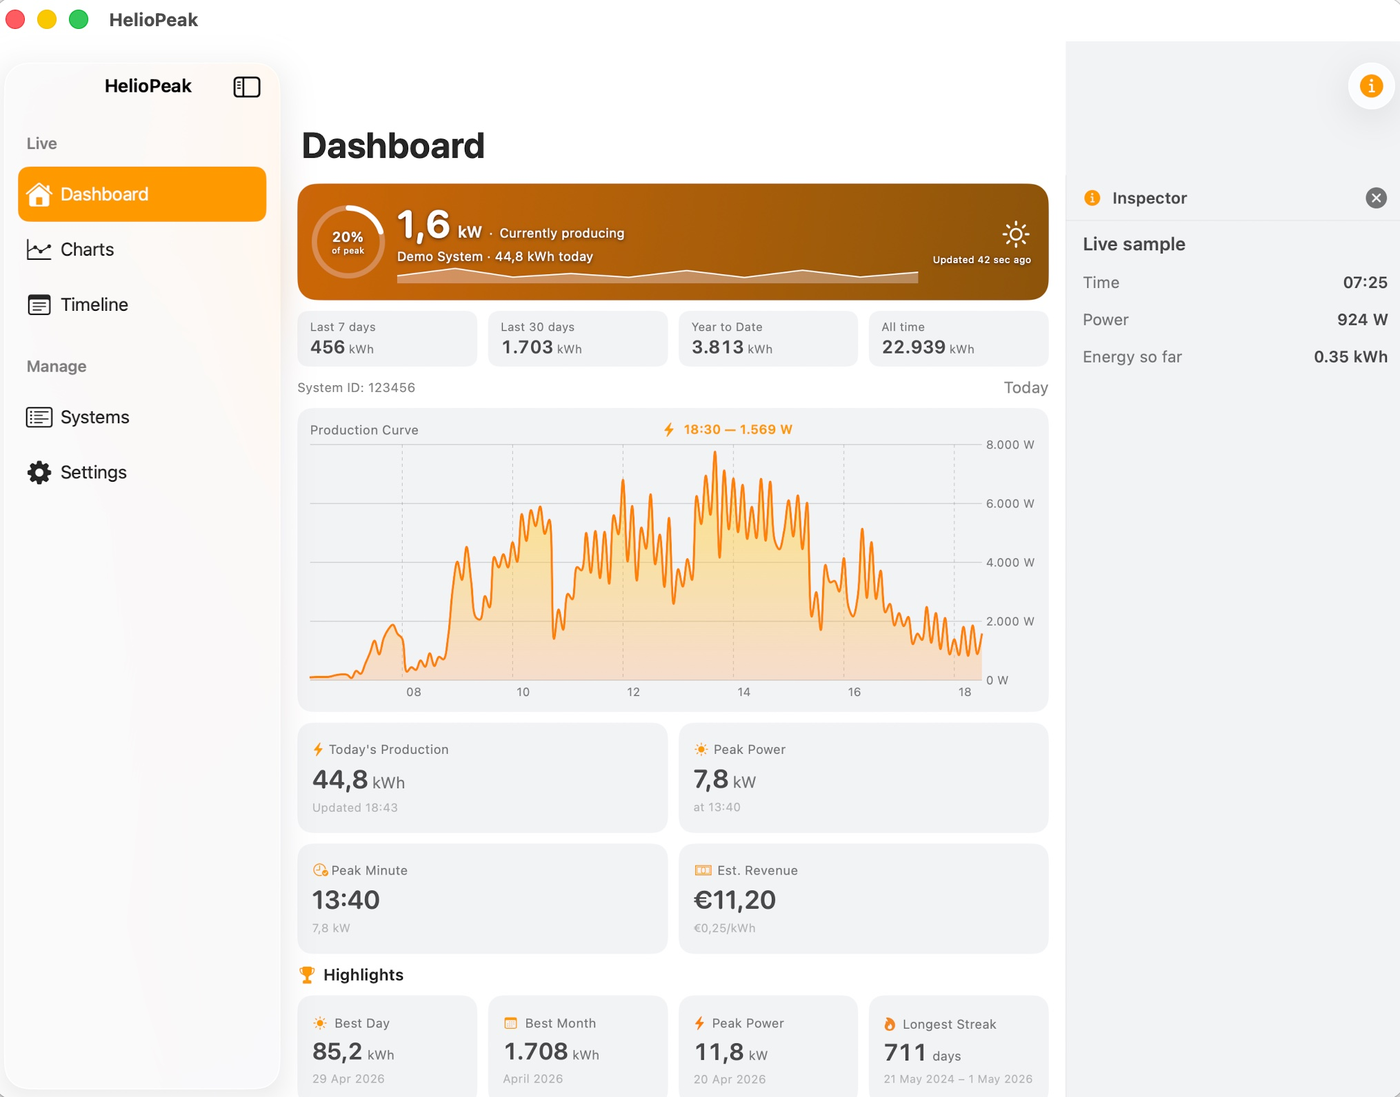
Real-time production curve, peak power, and estimated revenue, updated with every refresh.
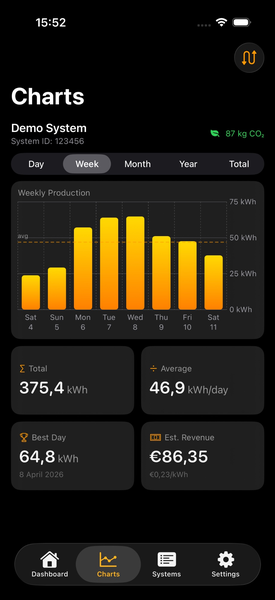
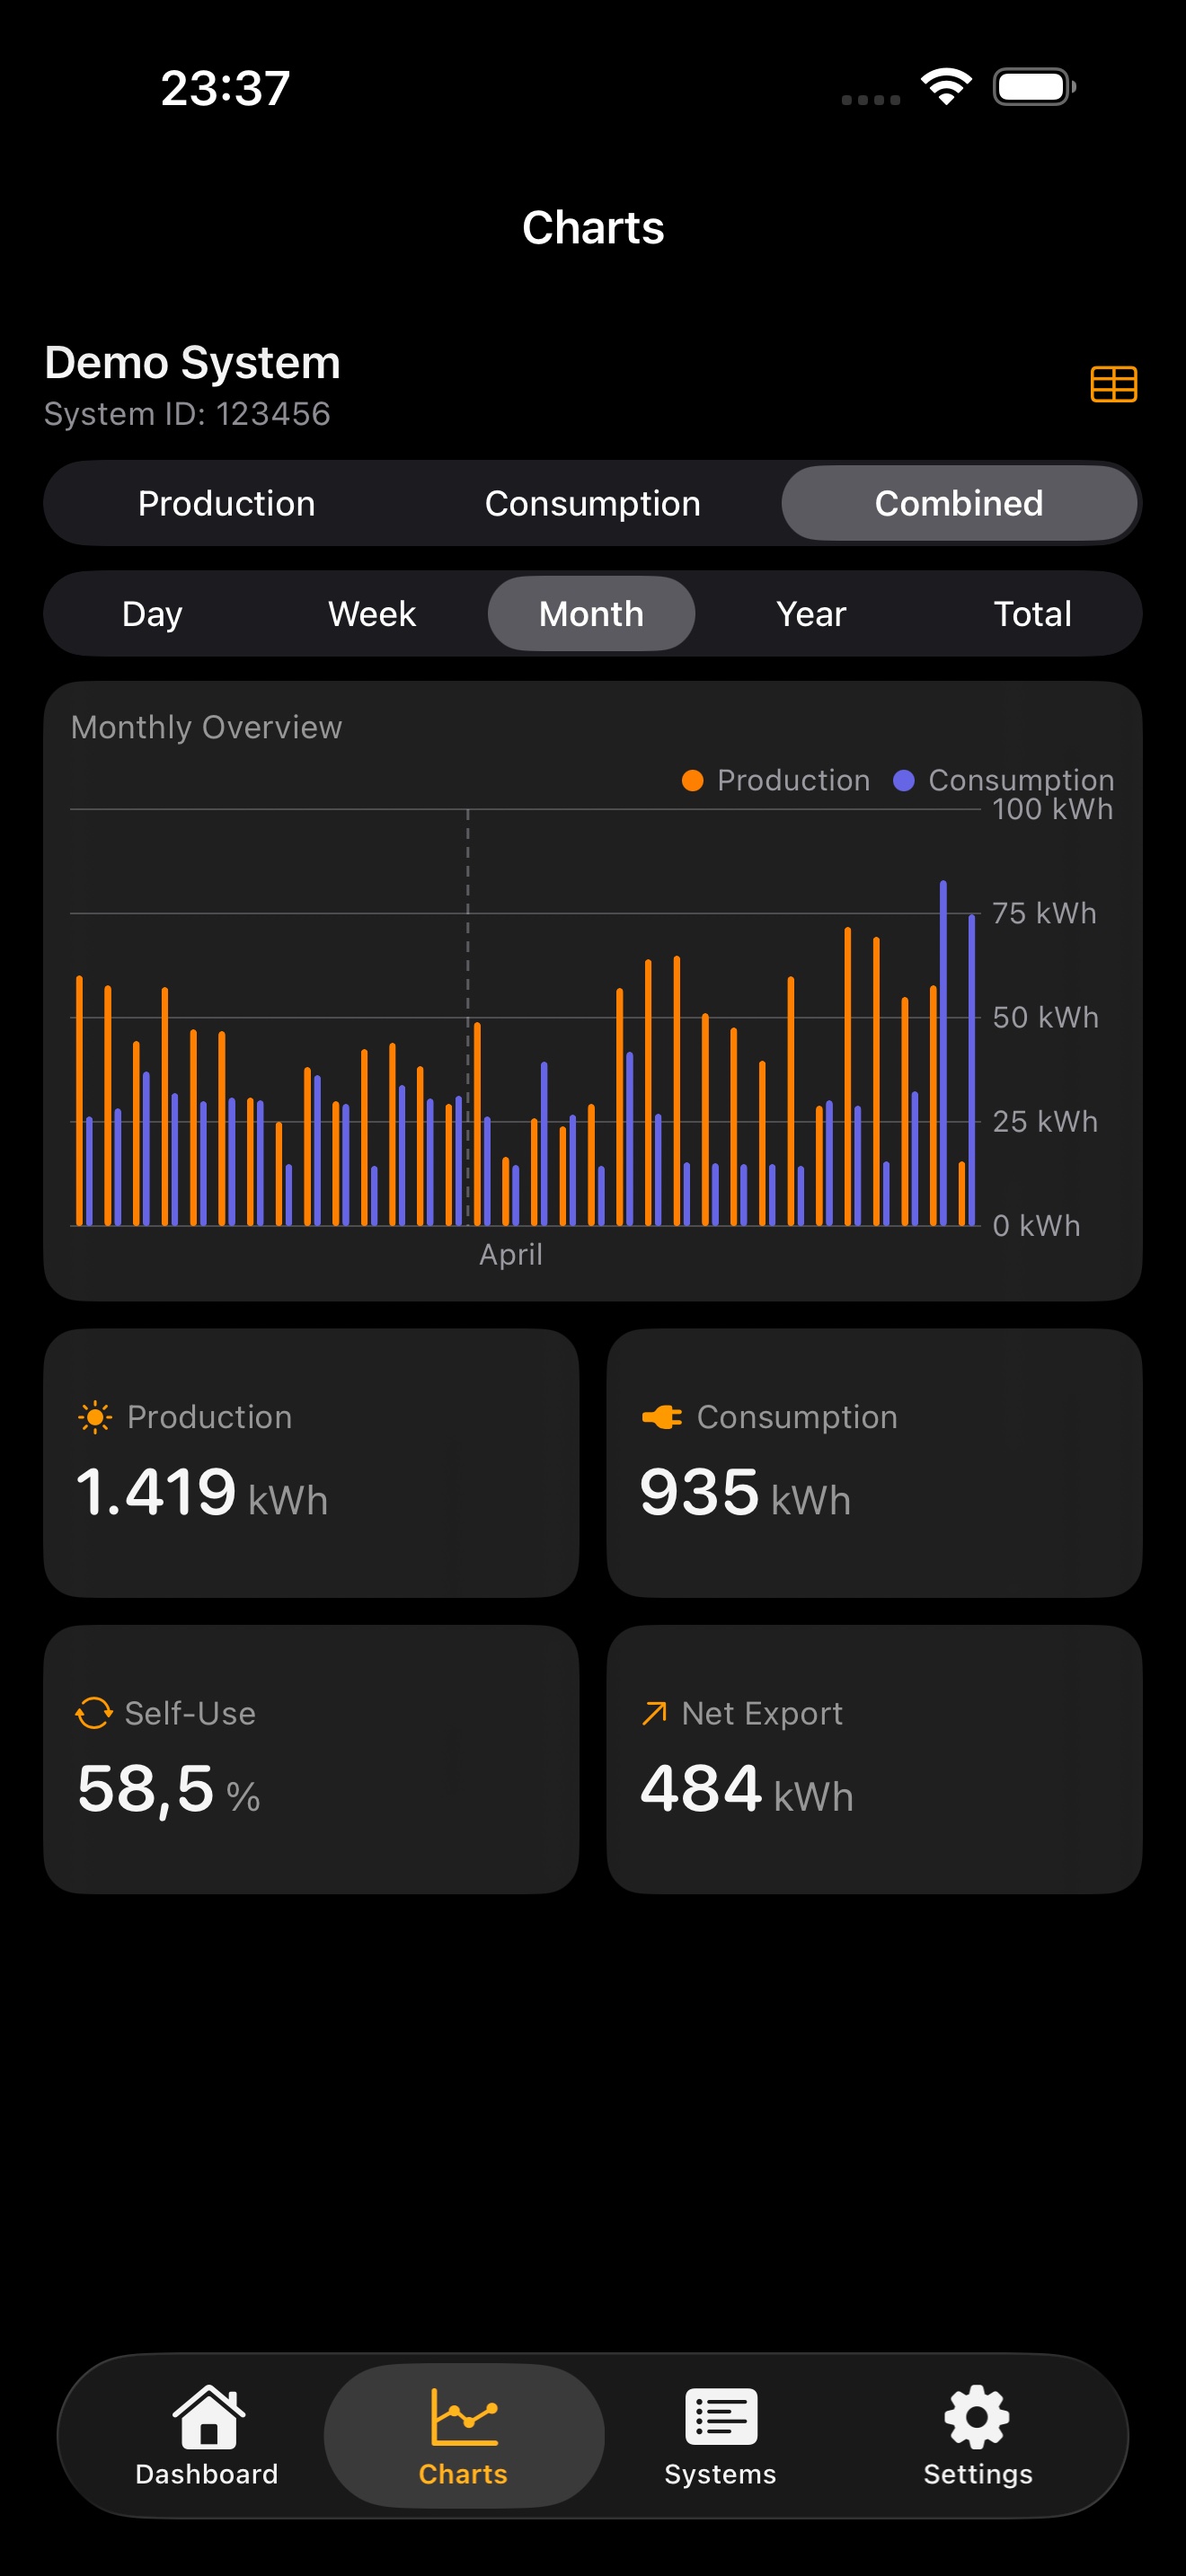
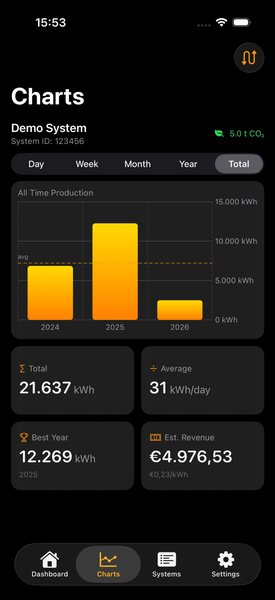
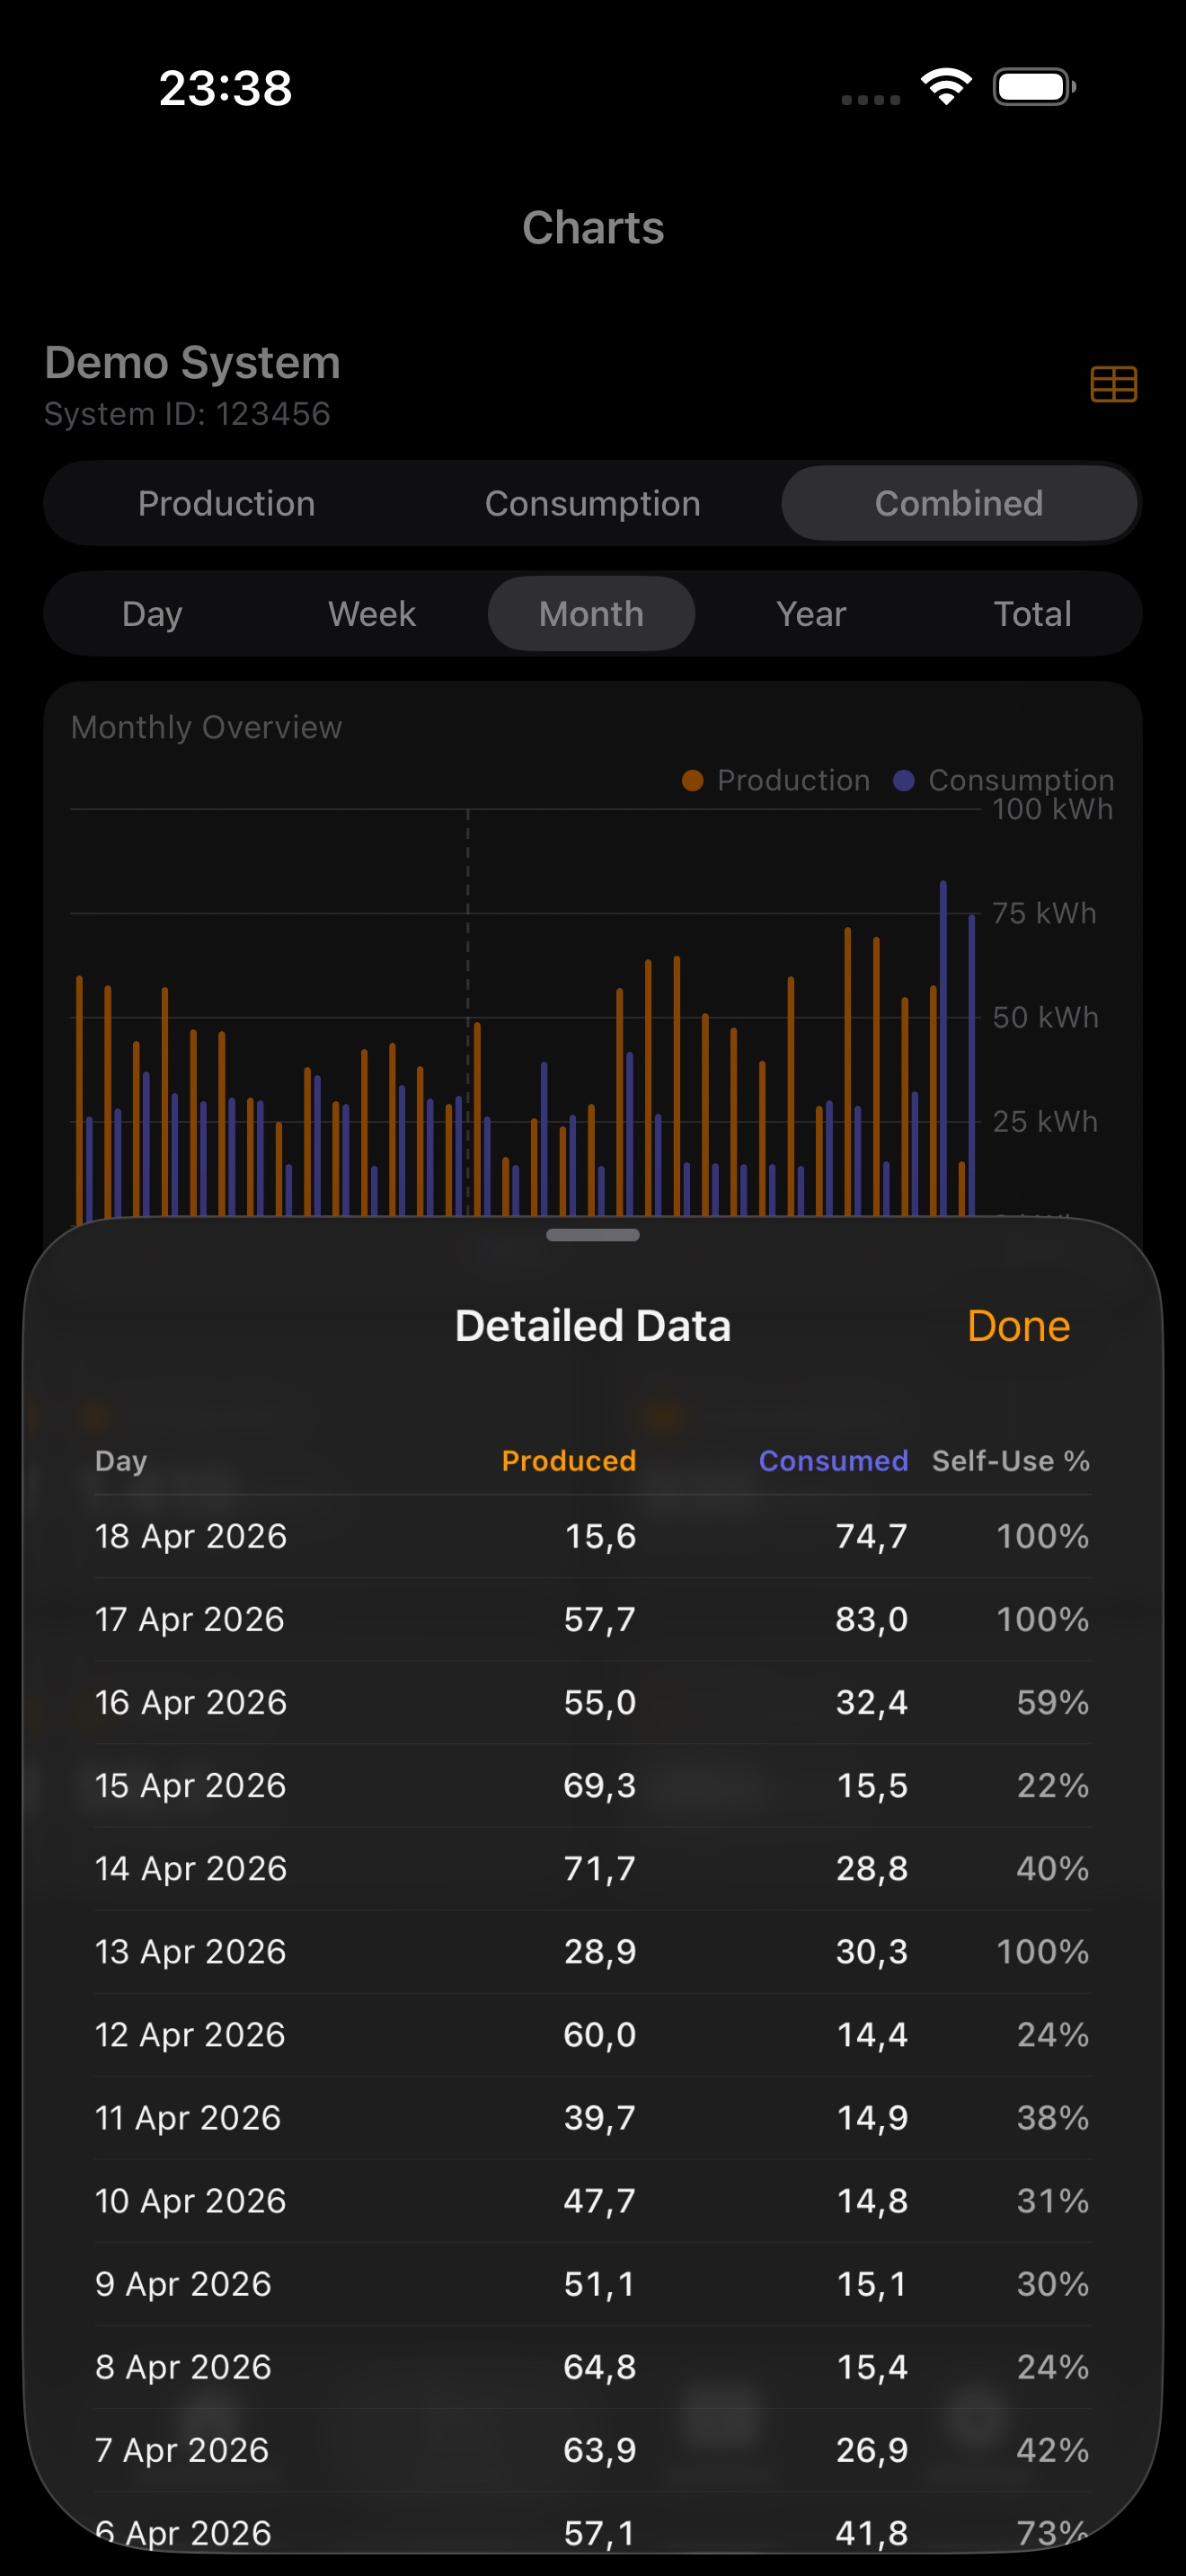
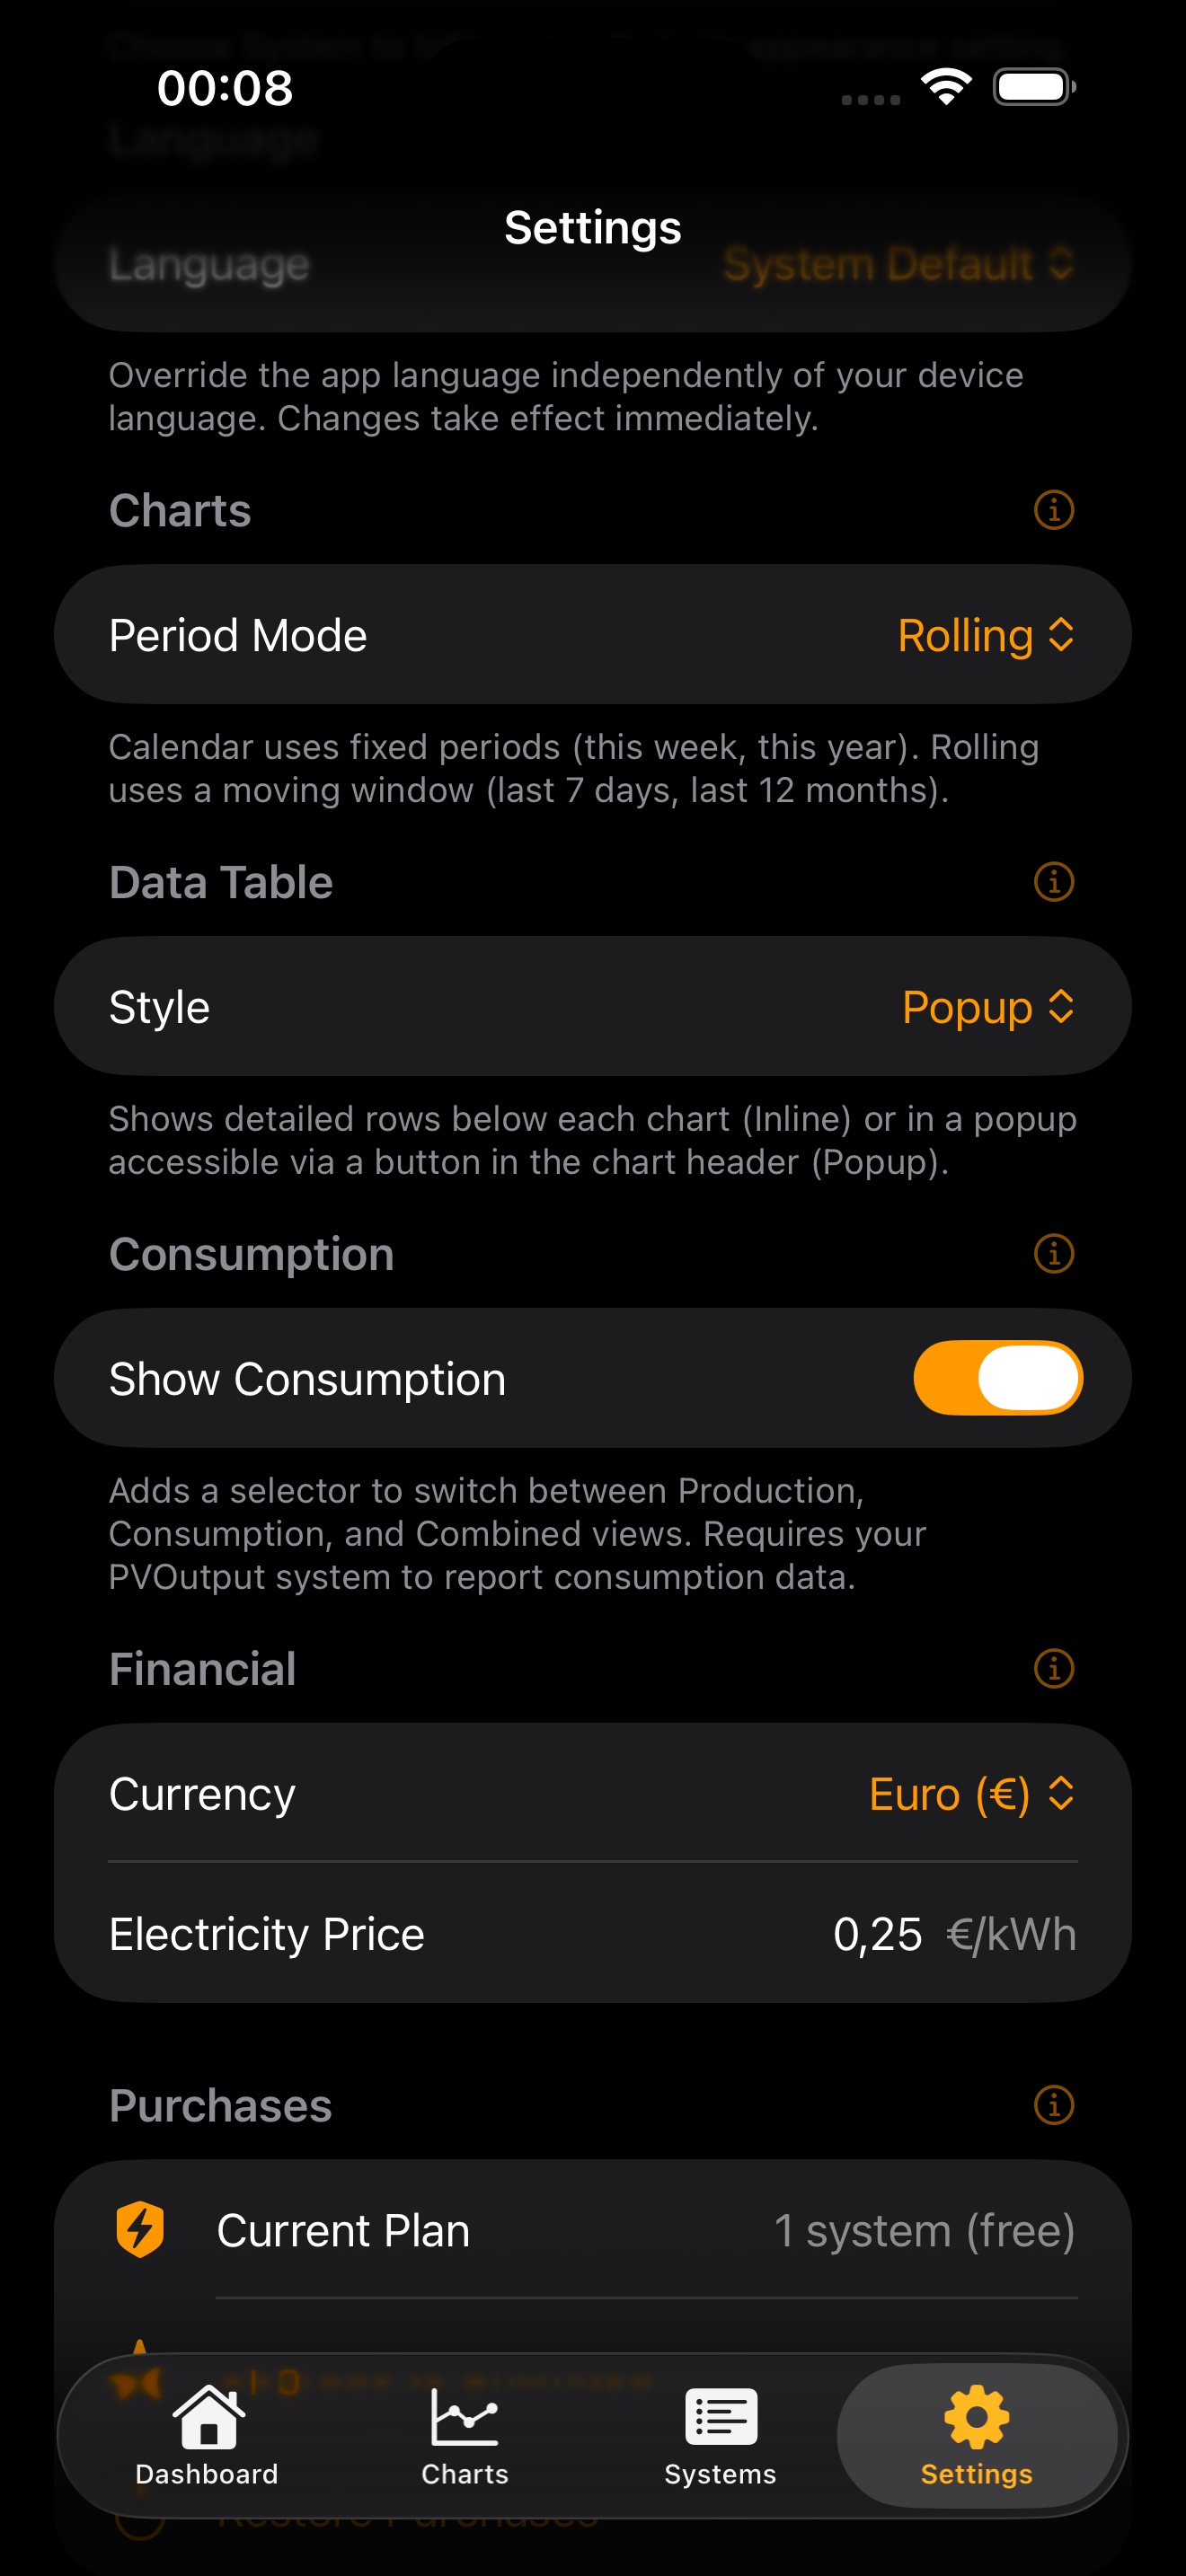
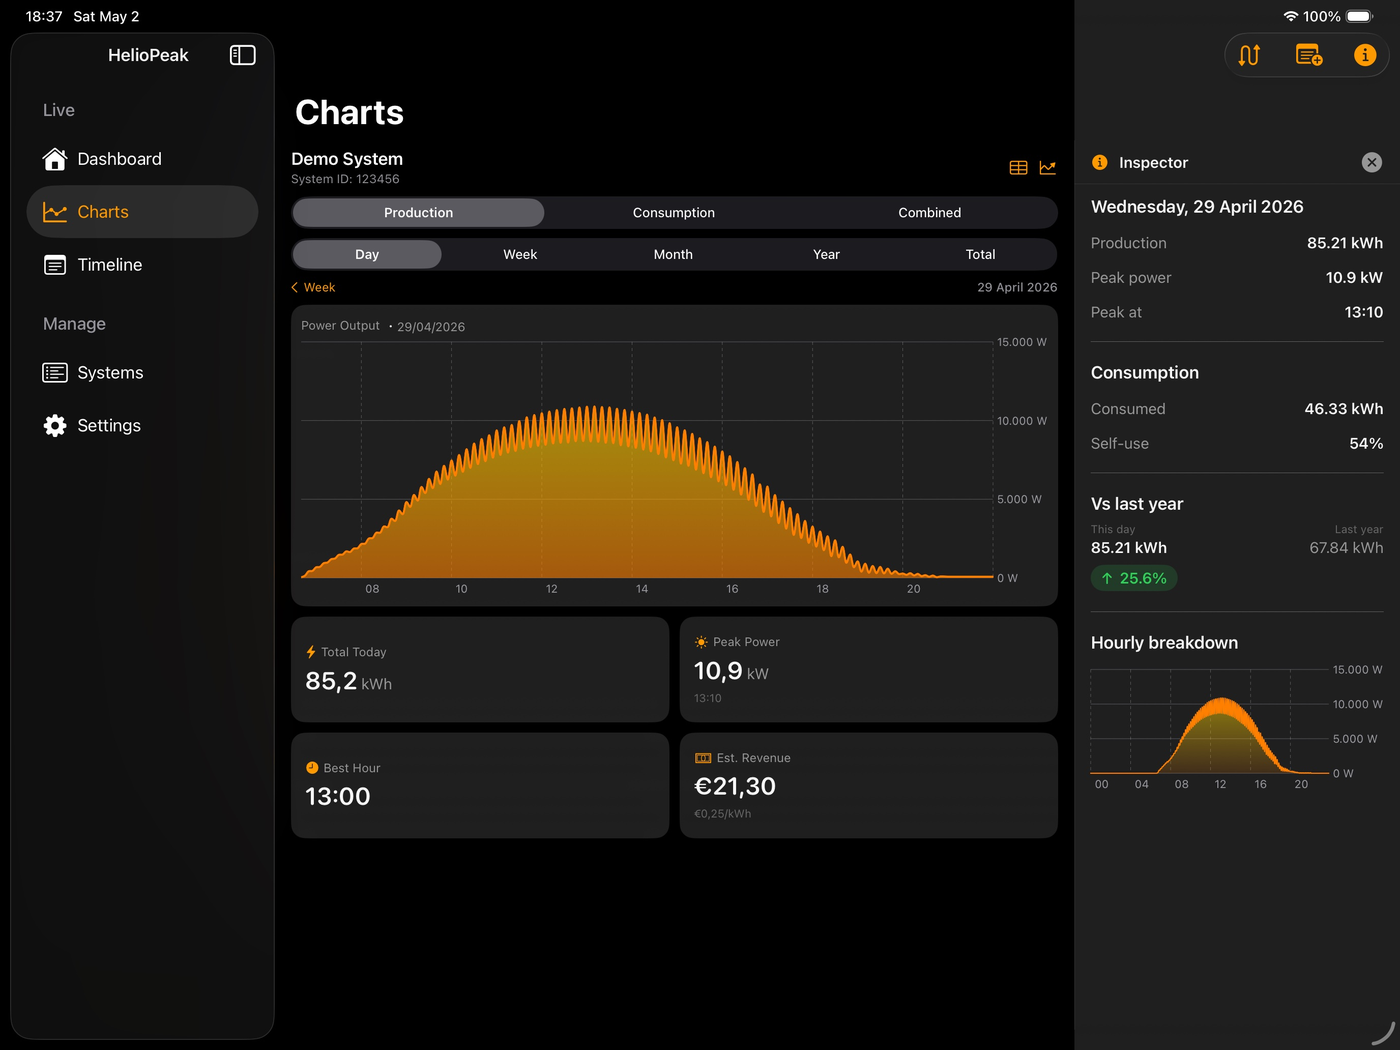
Day, week, month, year, and all-time charts for production and consumption. Tap any bar for details. Switch between calendar and rolling views.
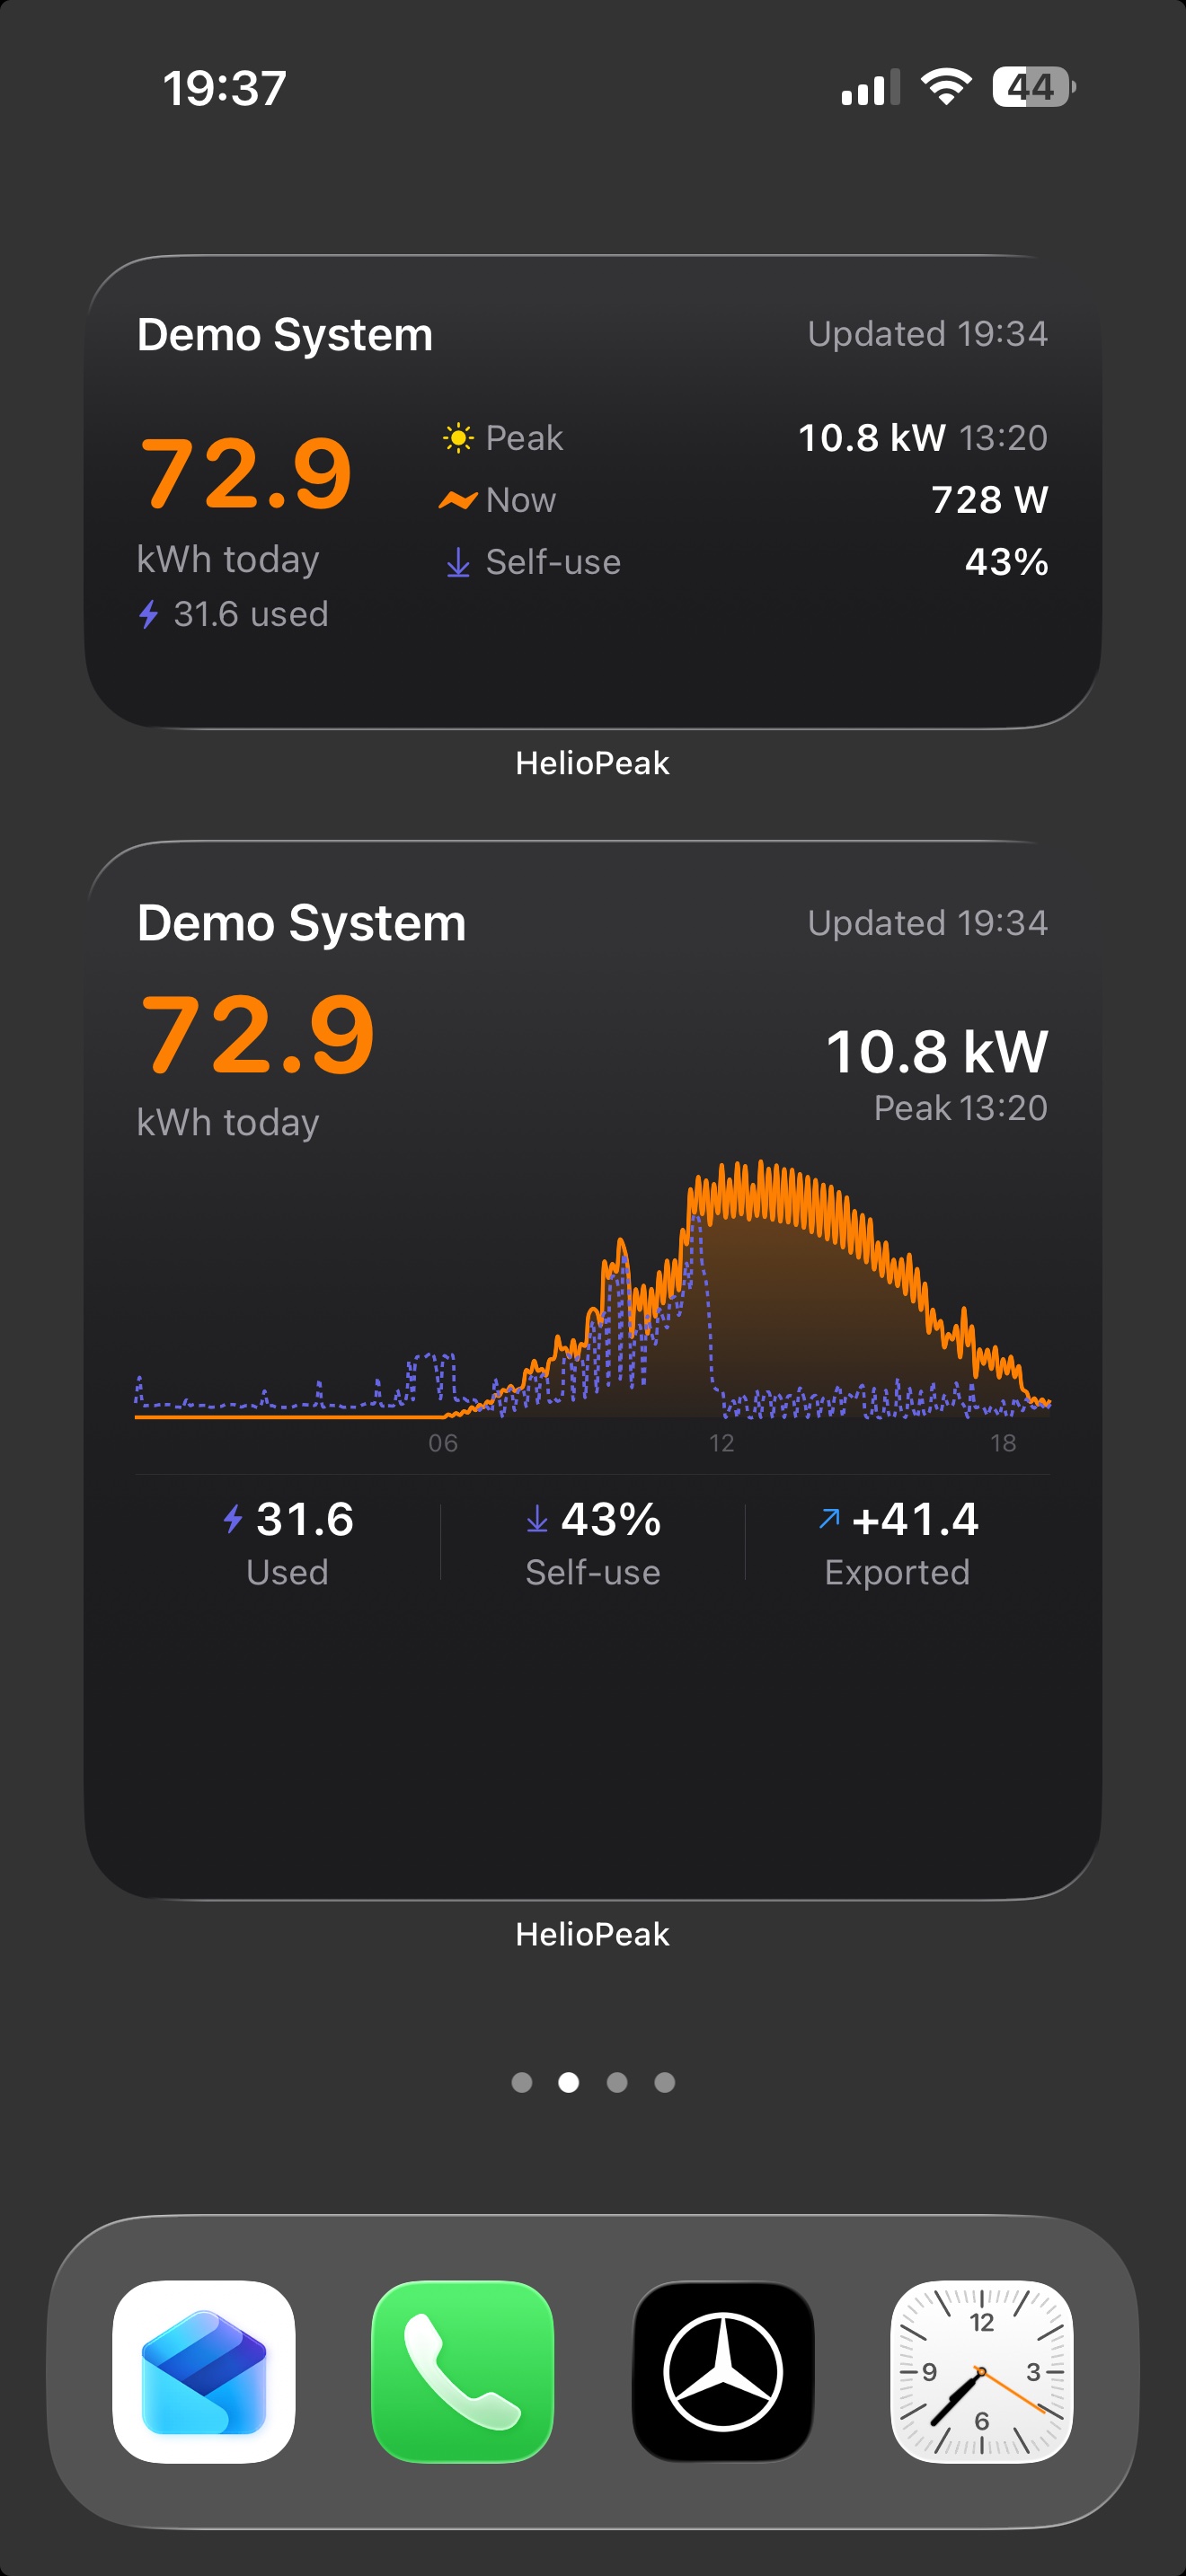
Three sizes. Today's production and consumption at a glance, with intraday chart on the largest size. Matches your app's appearance setting.
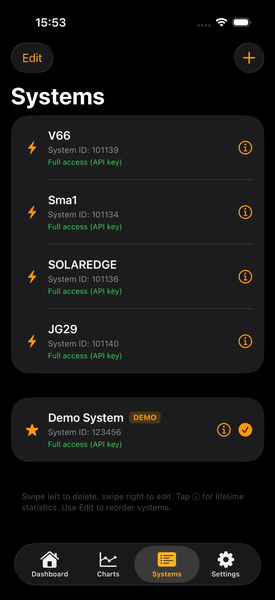
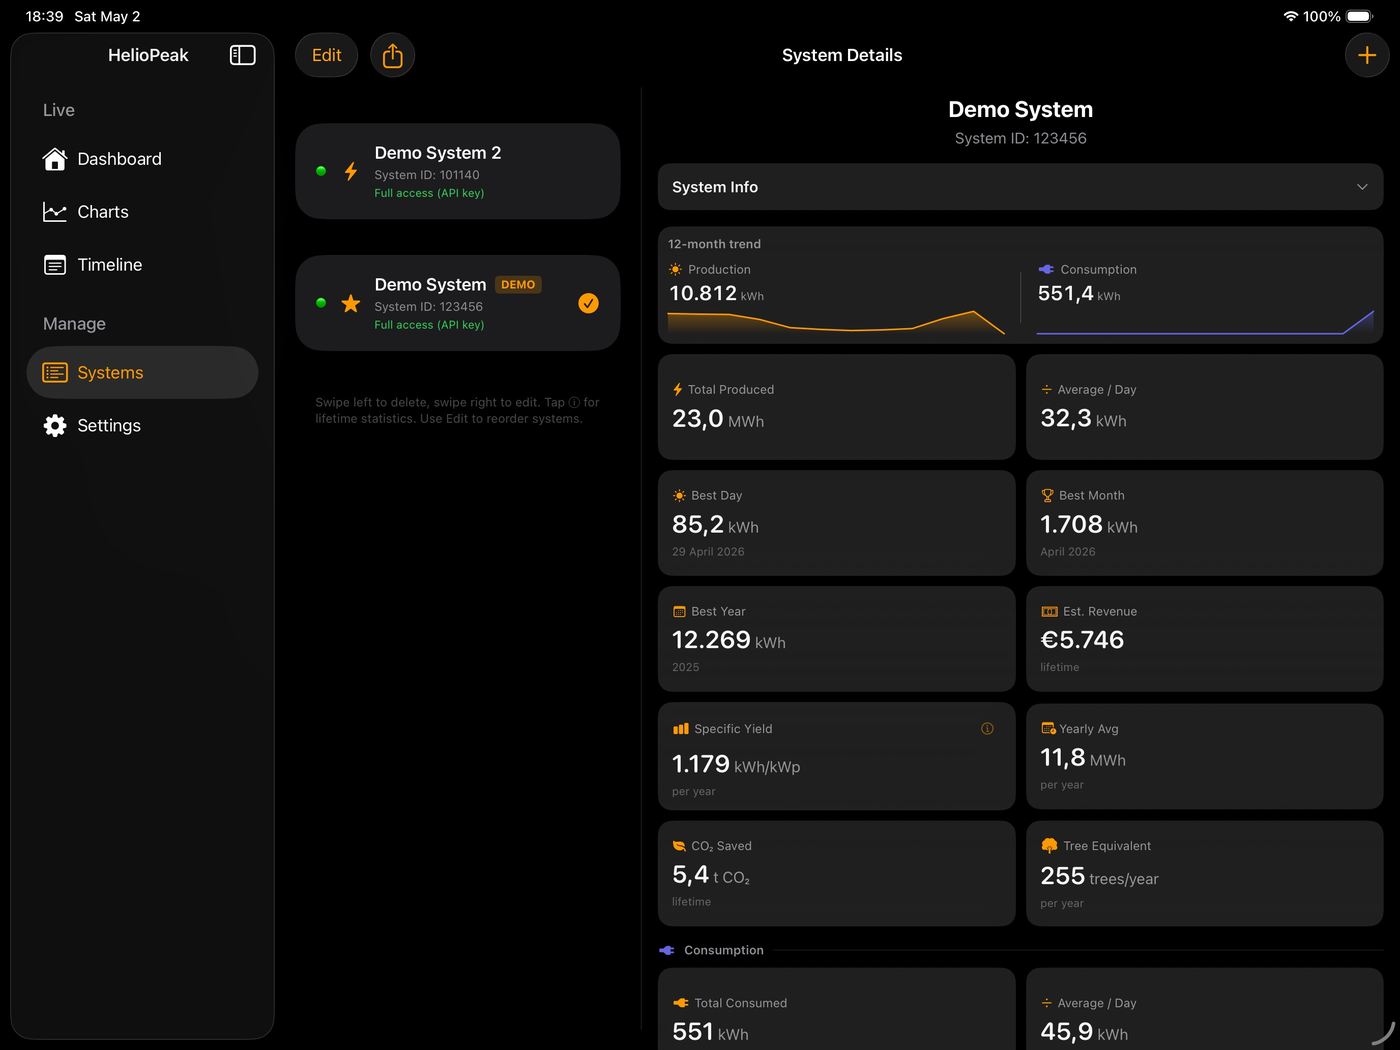
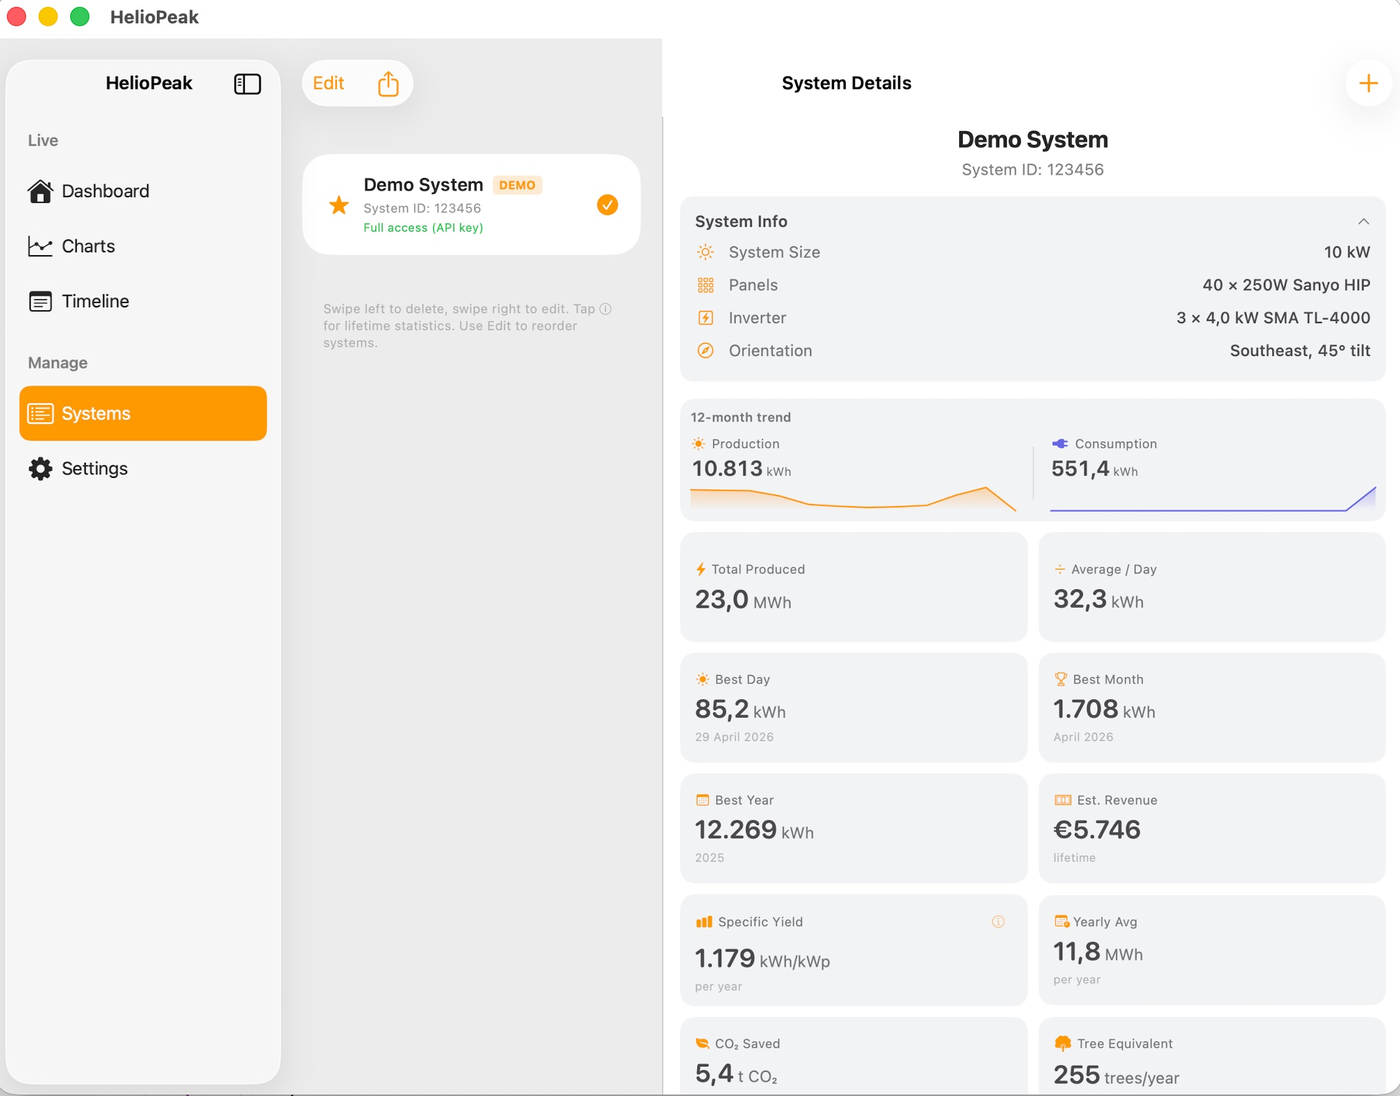
Monitor all your solar installations in one app. Quick switch from any screen. Lifetime statistics per system.
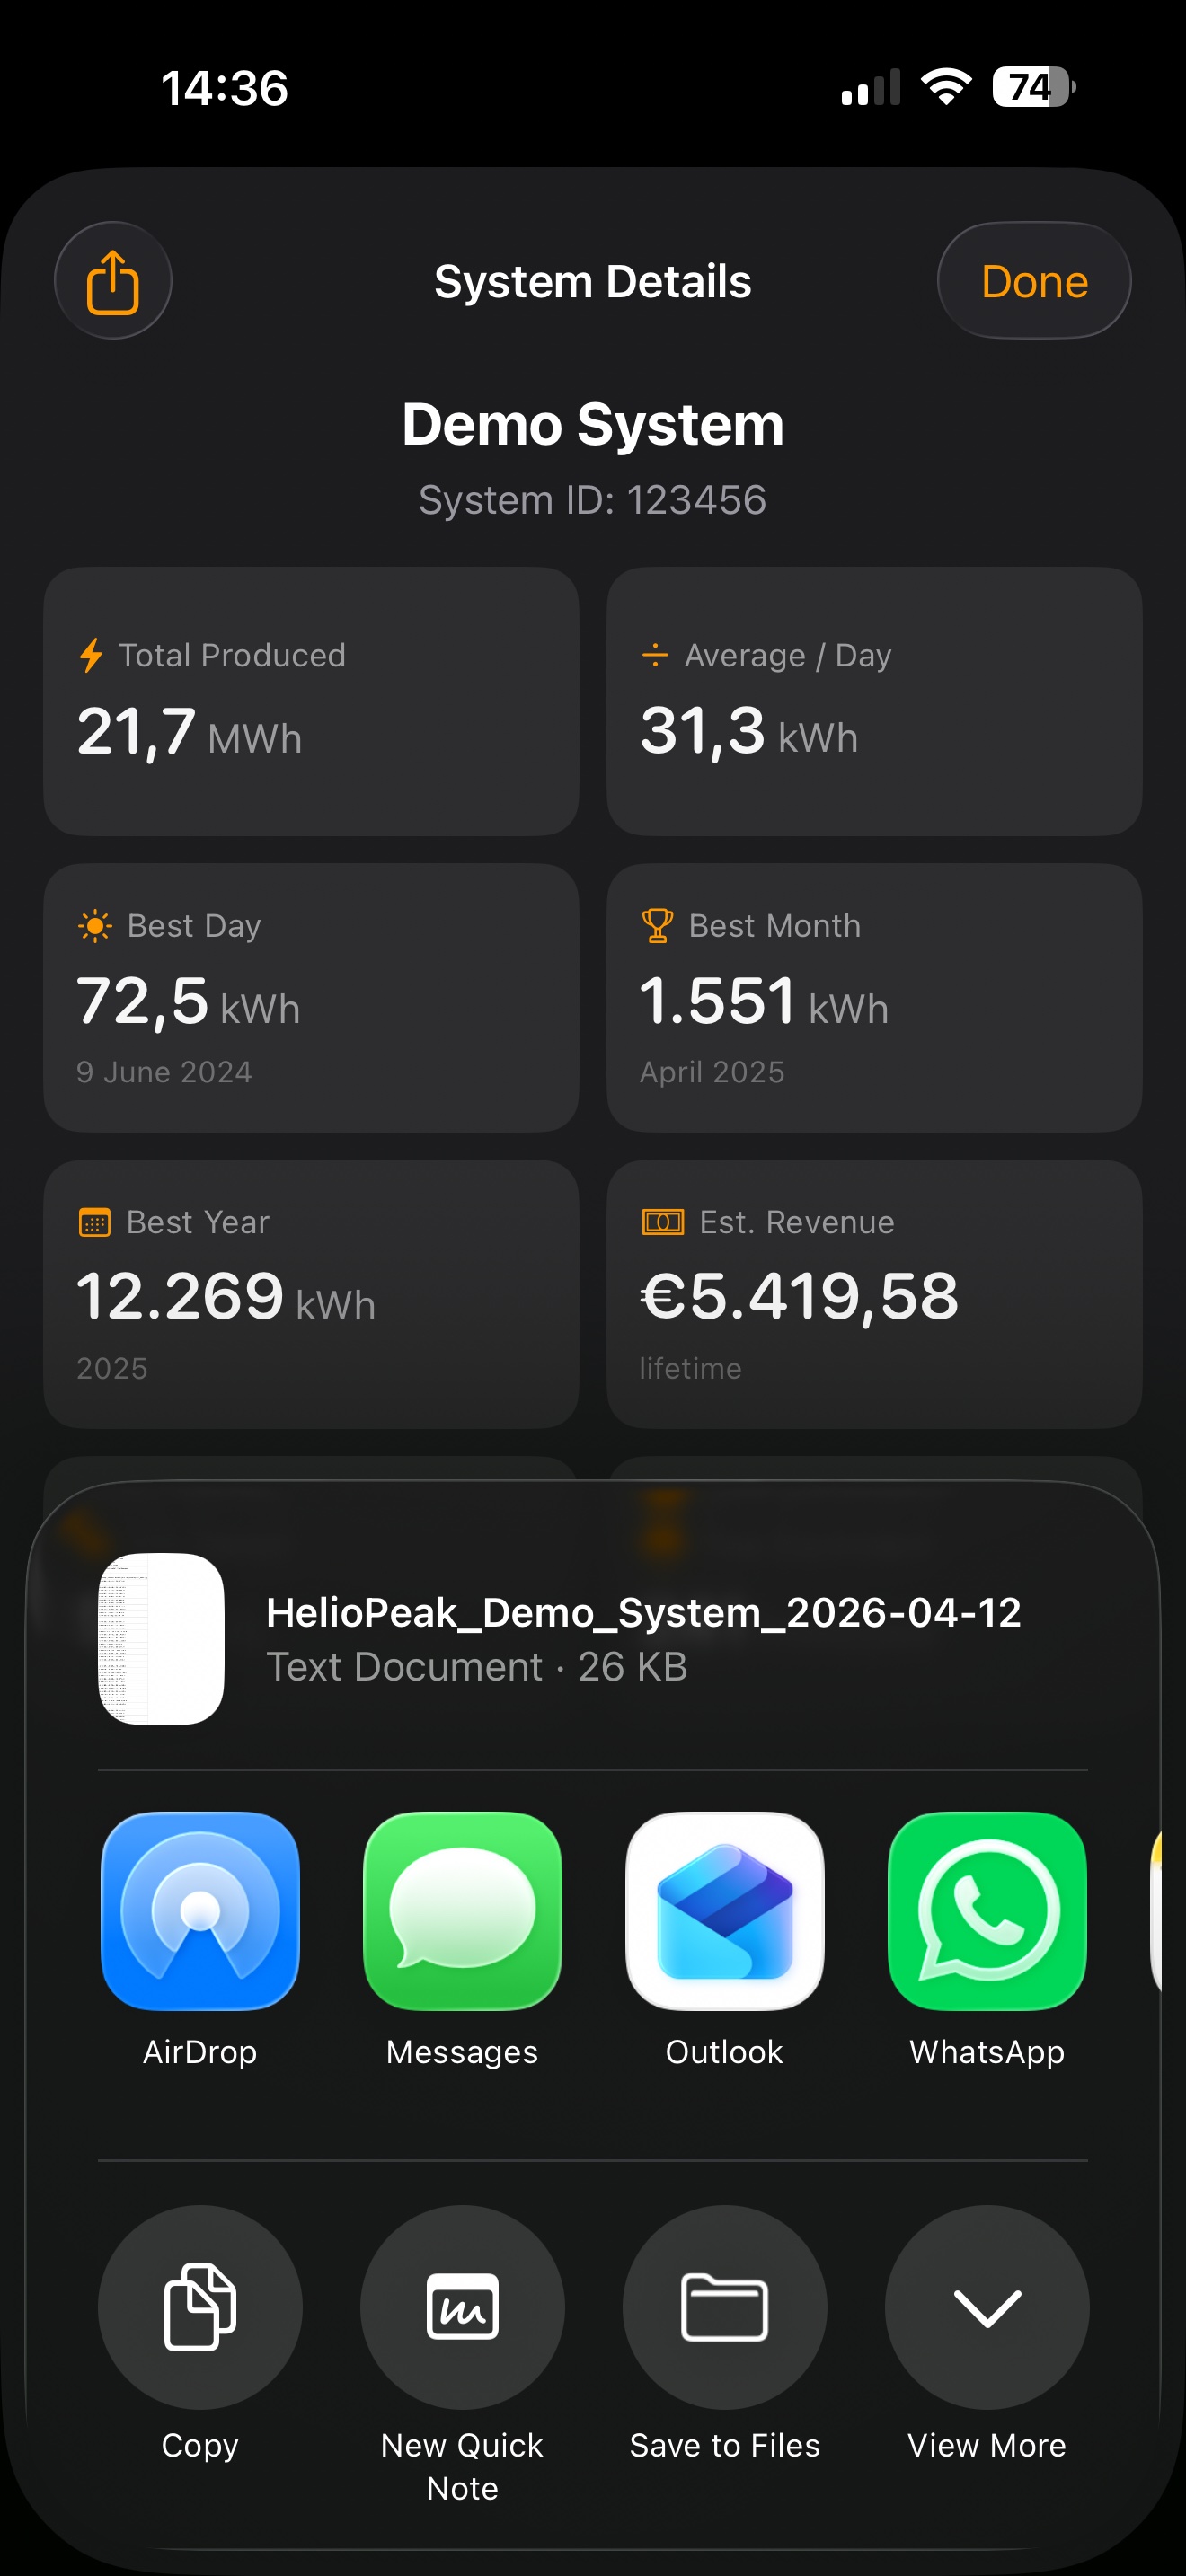
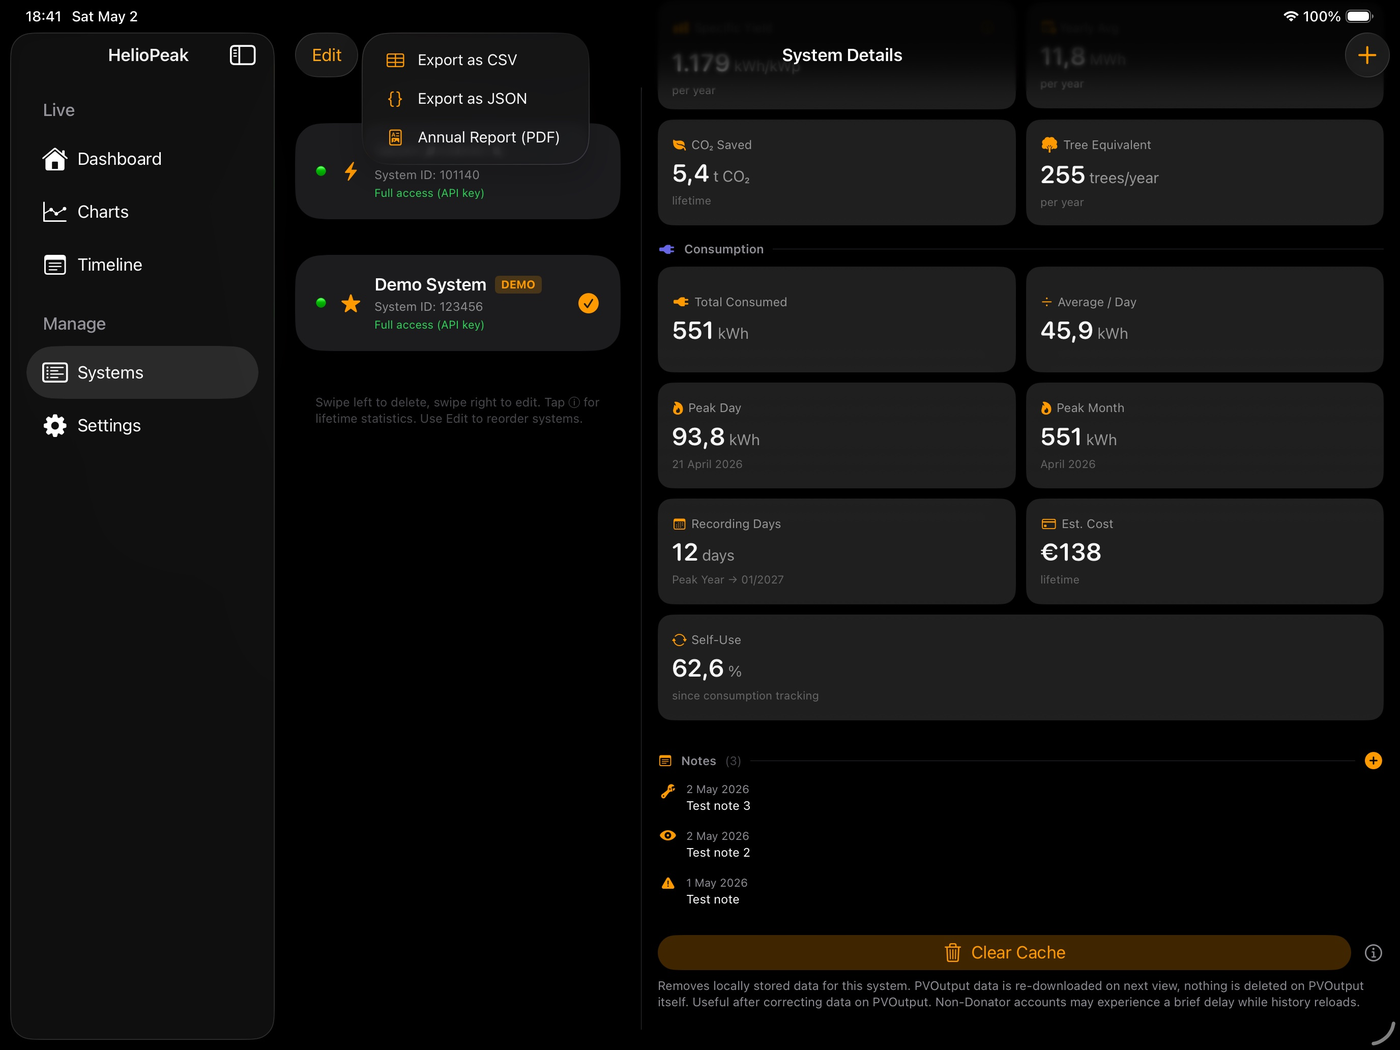
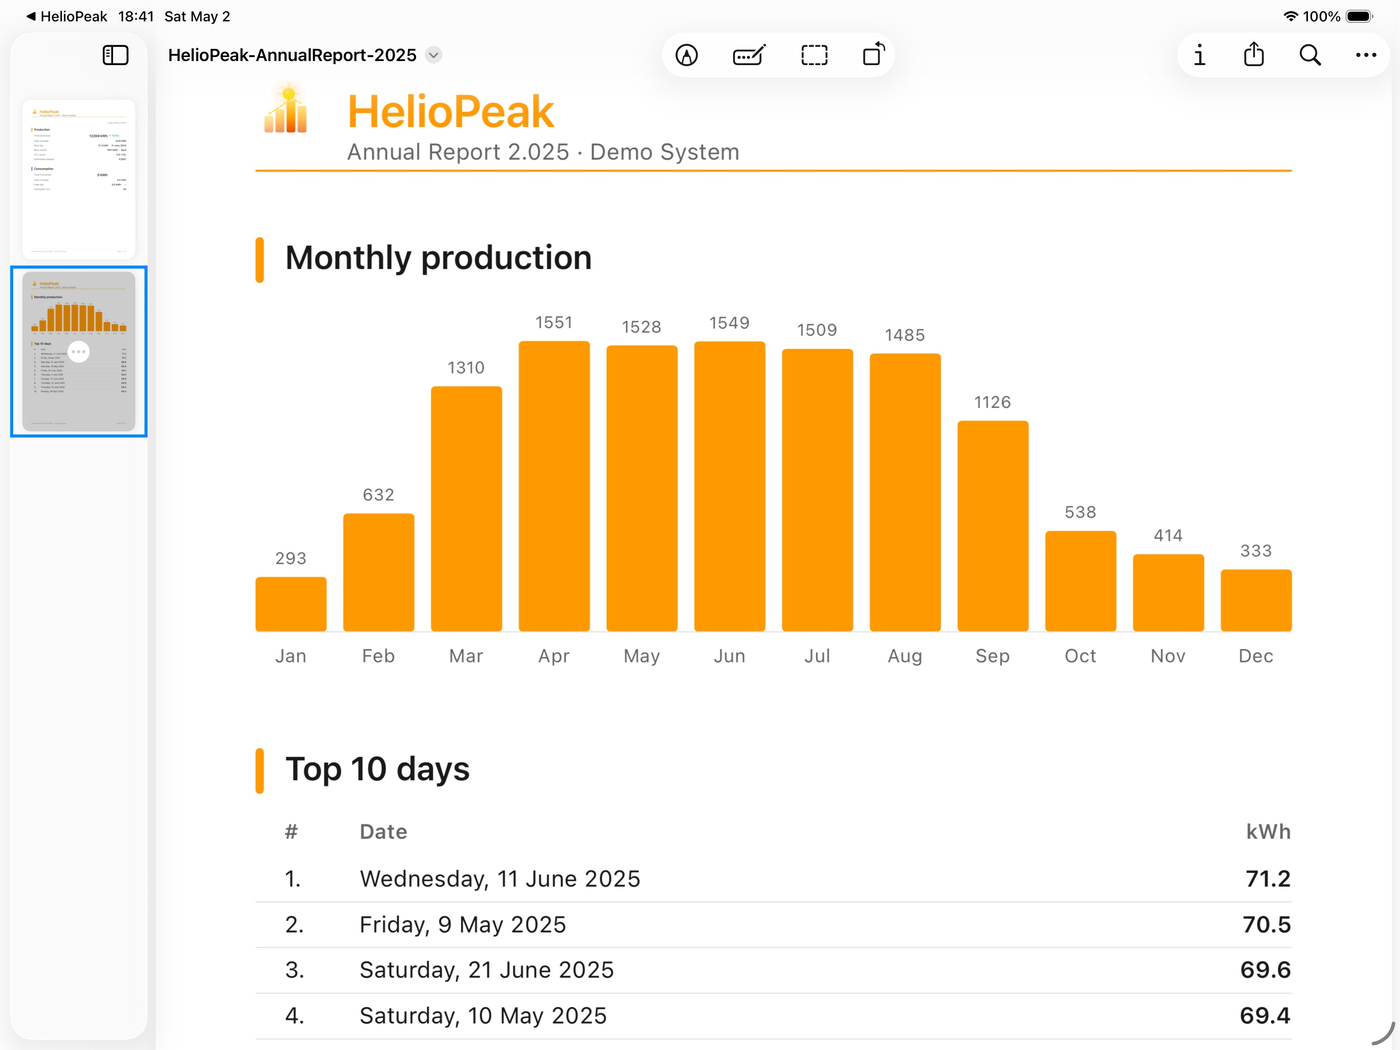
Export your complete history as CSV for Excel, JSON for scripts, or the multi-page Annual Report PDF. Notes included in CSV and JSON.
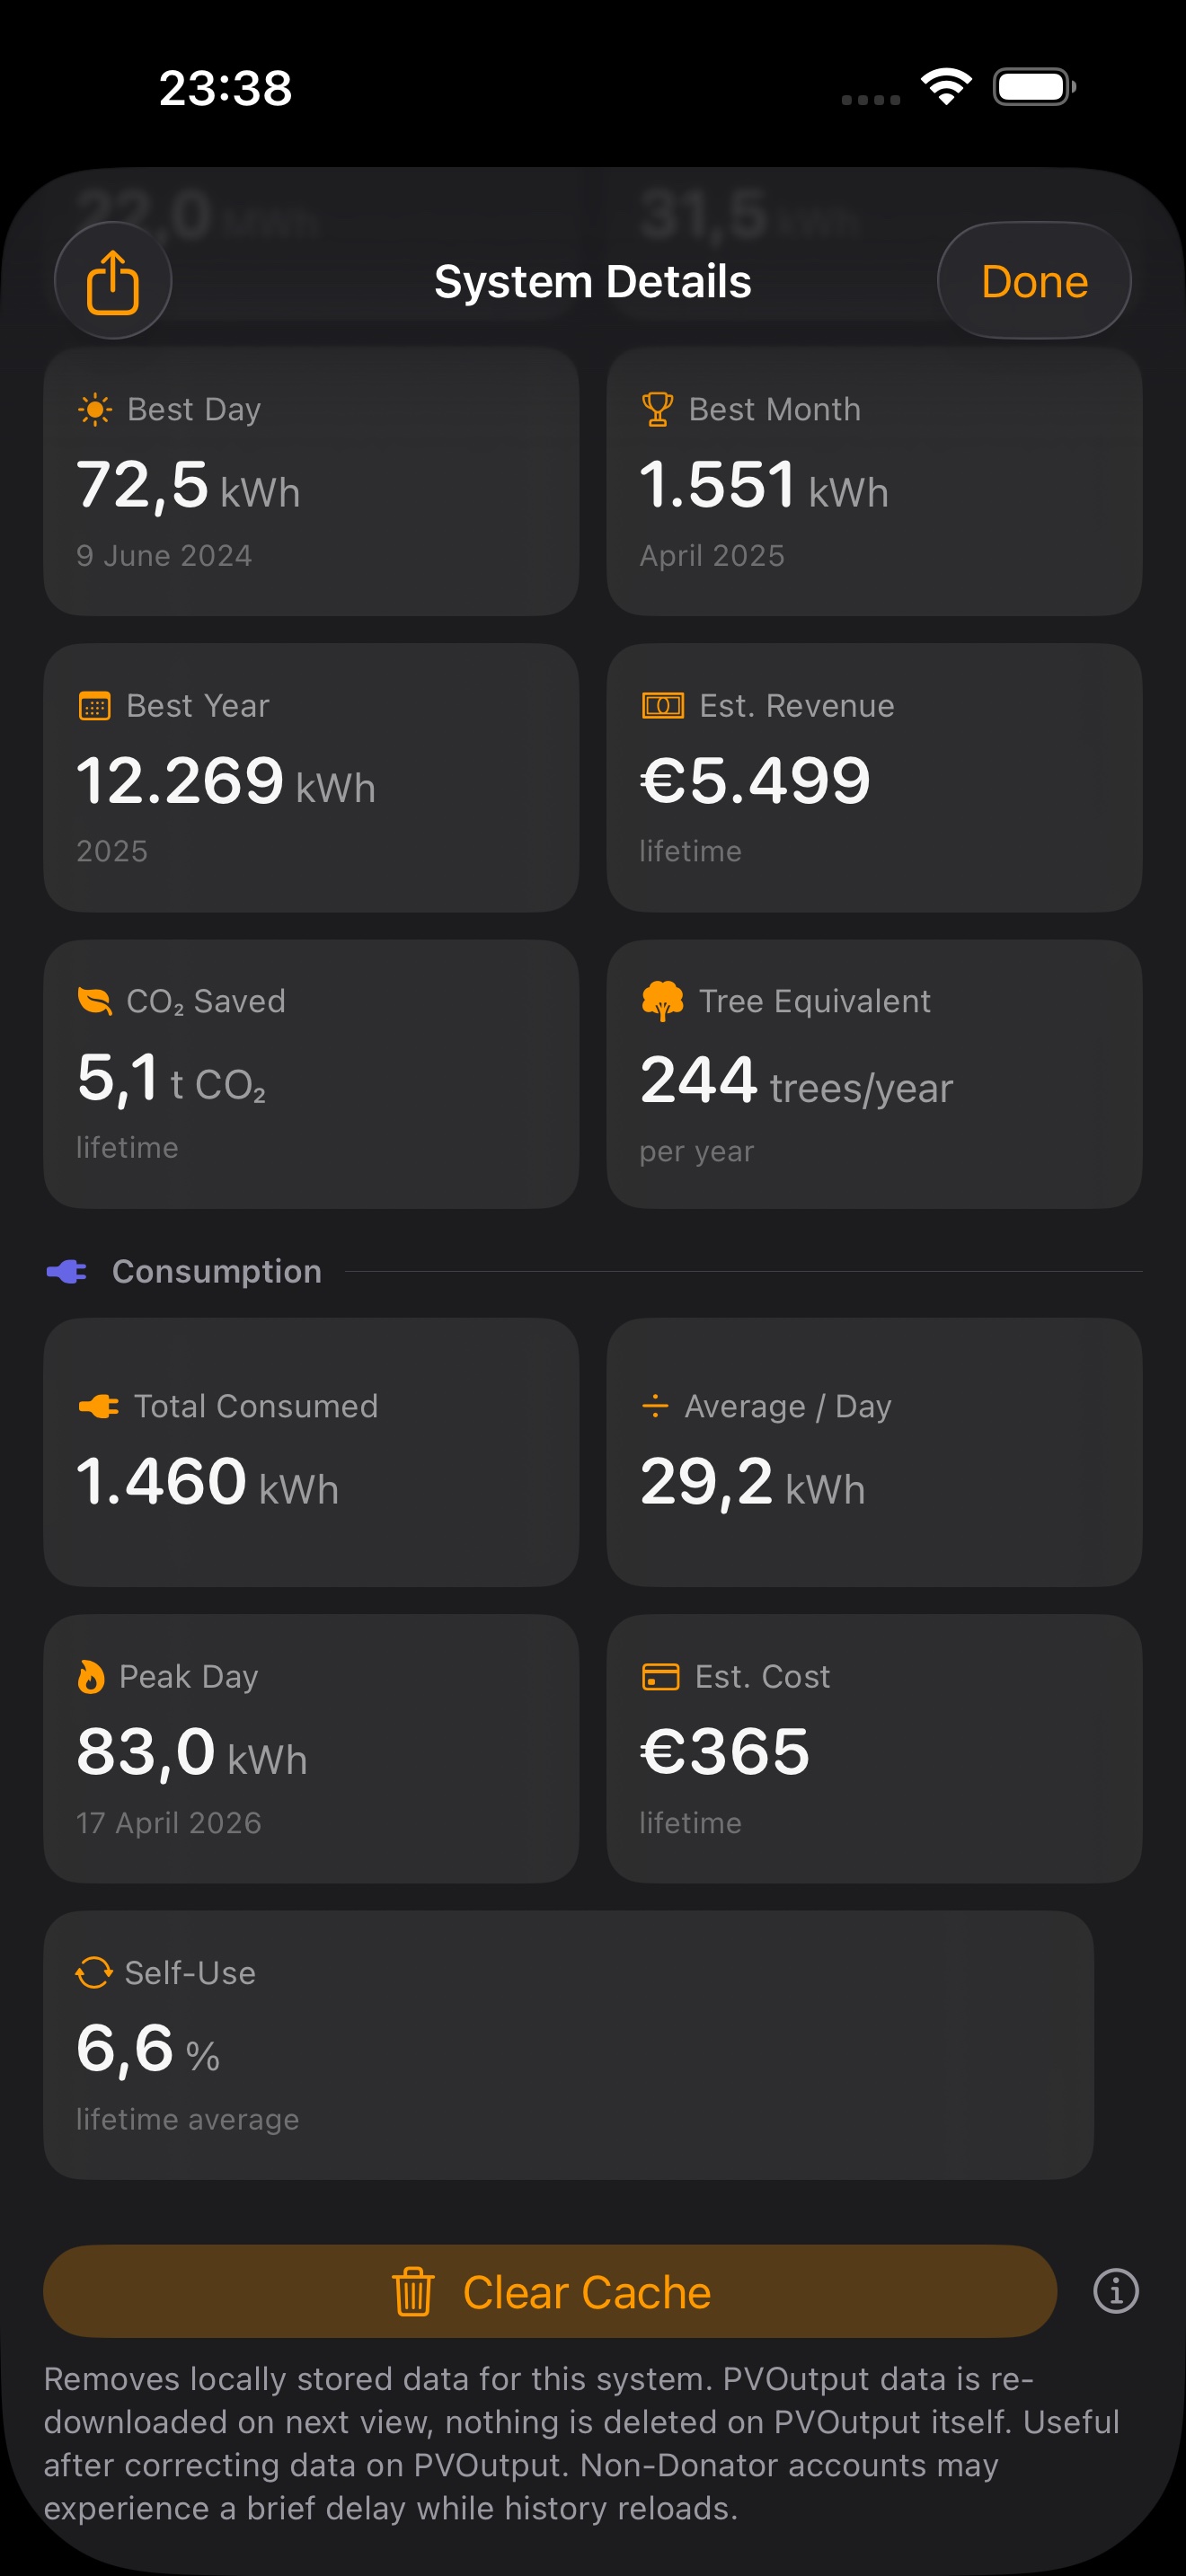
See how much carbon dioxide your panels have offset, and the equivalent number of trees planted per year.
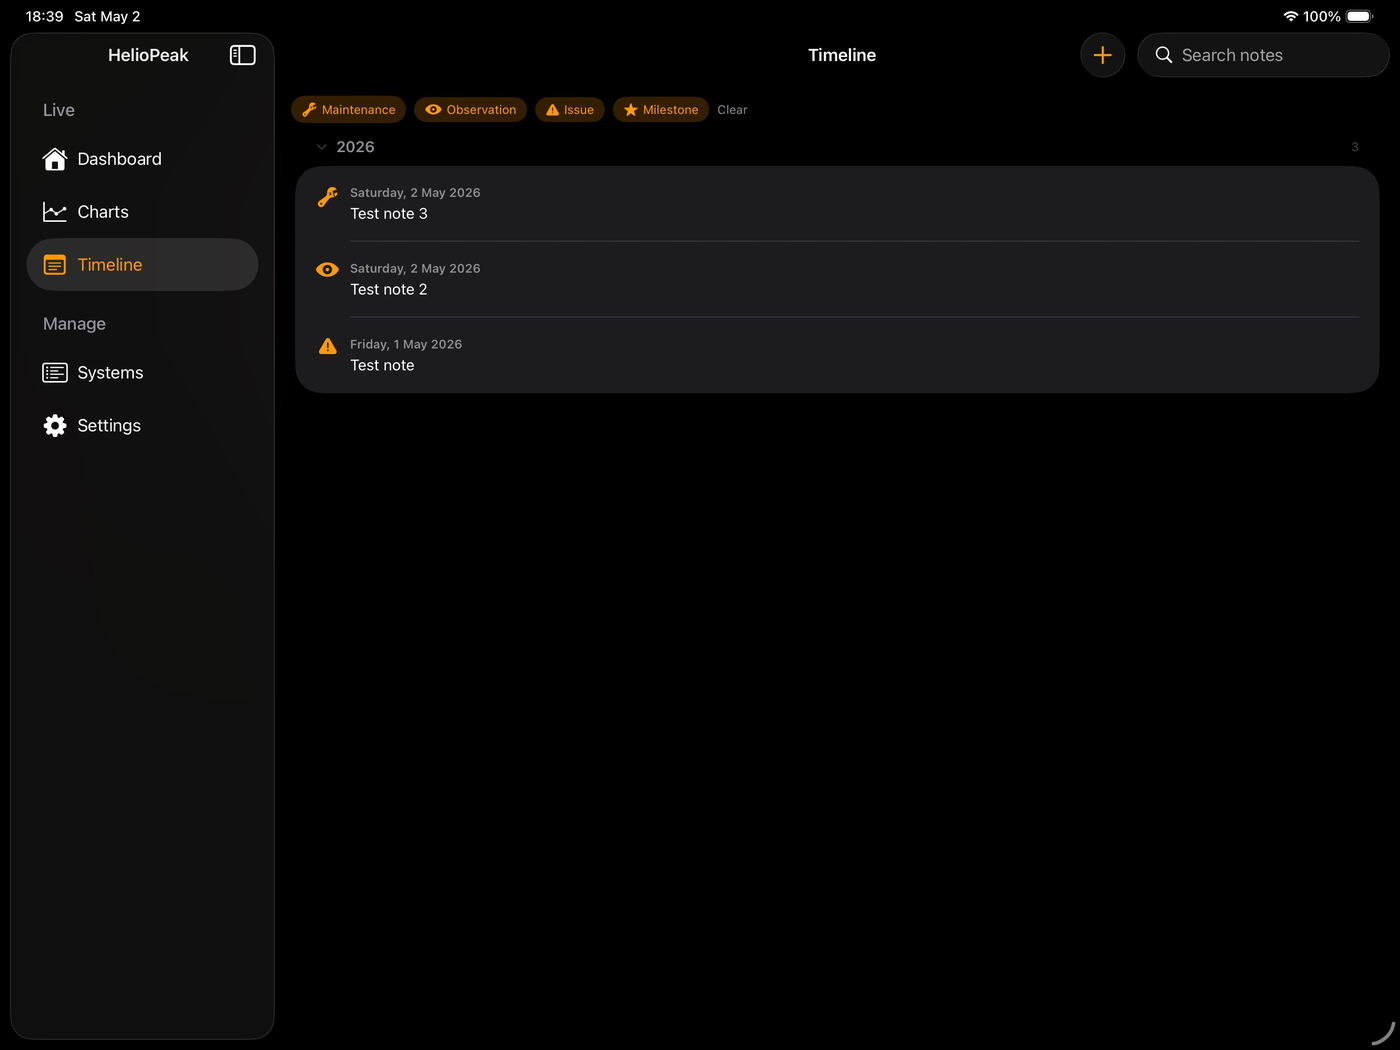
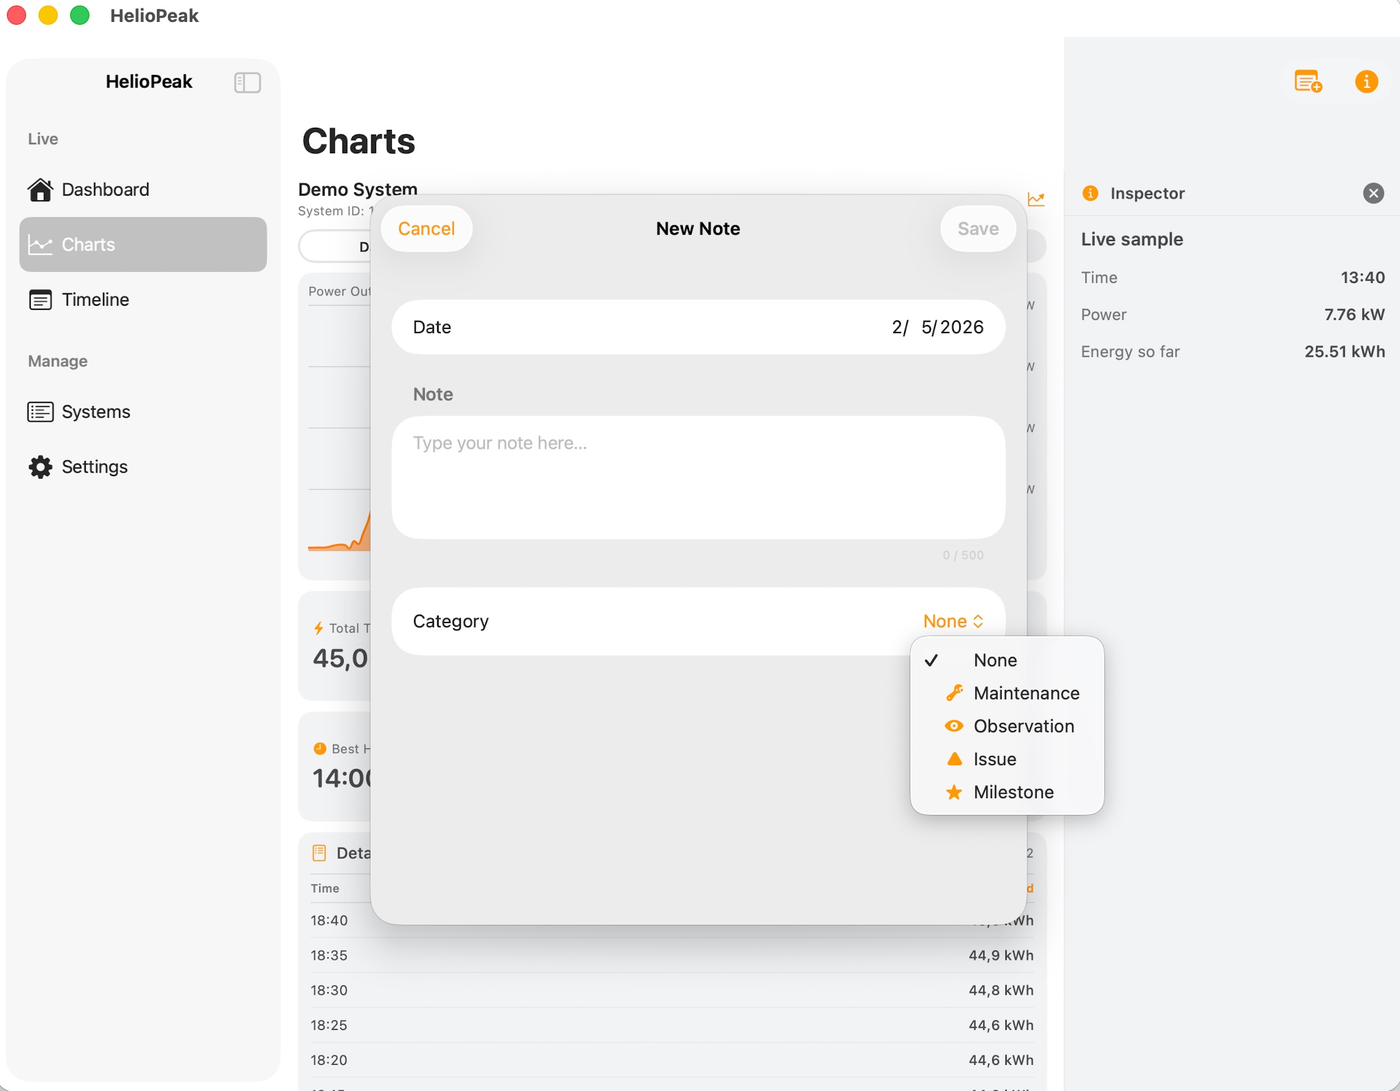
Attach private notes to specific days — maintenance, observations, milestones. Synced across your Apple devices via iCloud, never visible to us.
Multi-page A4 report for any year. Cover, monthly breakdown, top 10 days, year-over-year delta. Available in all six languages.
Sidebar navigation, Live Status hero, Inspector panel, year heatmap, keyboard shortcuts. Runs natively on Apple Silicon Macs.
Rotate for chart-priority mode. Stat cards step aside, the production curve fills the full screen.
Color-coded dots show system status at a glance. Green if productive within 24h, red for likely inverter issues. Local check, no extra API calls.
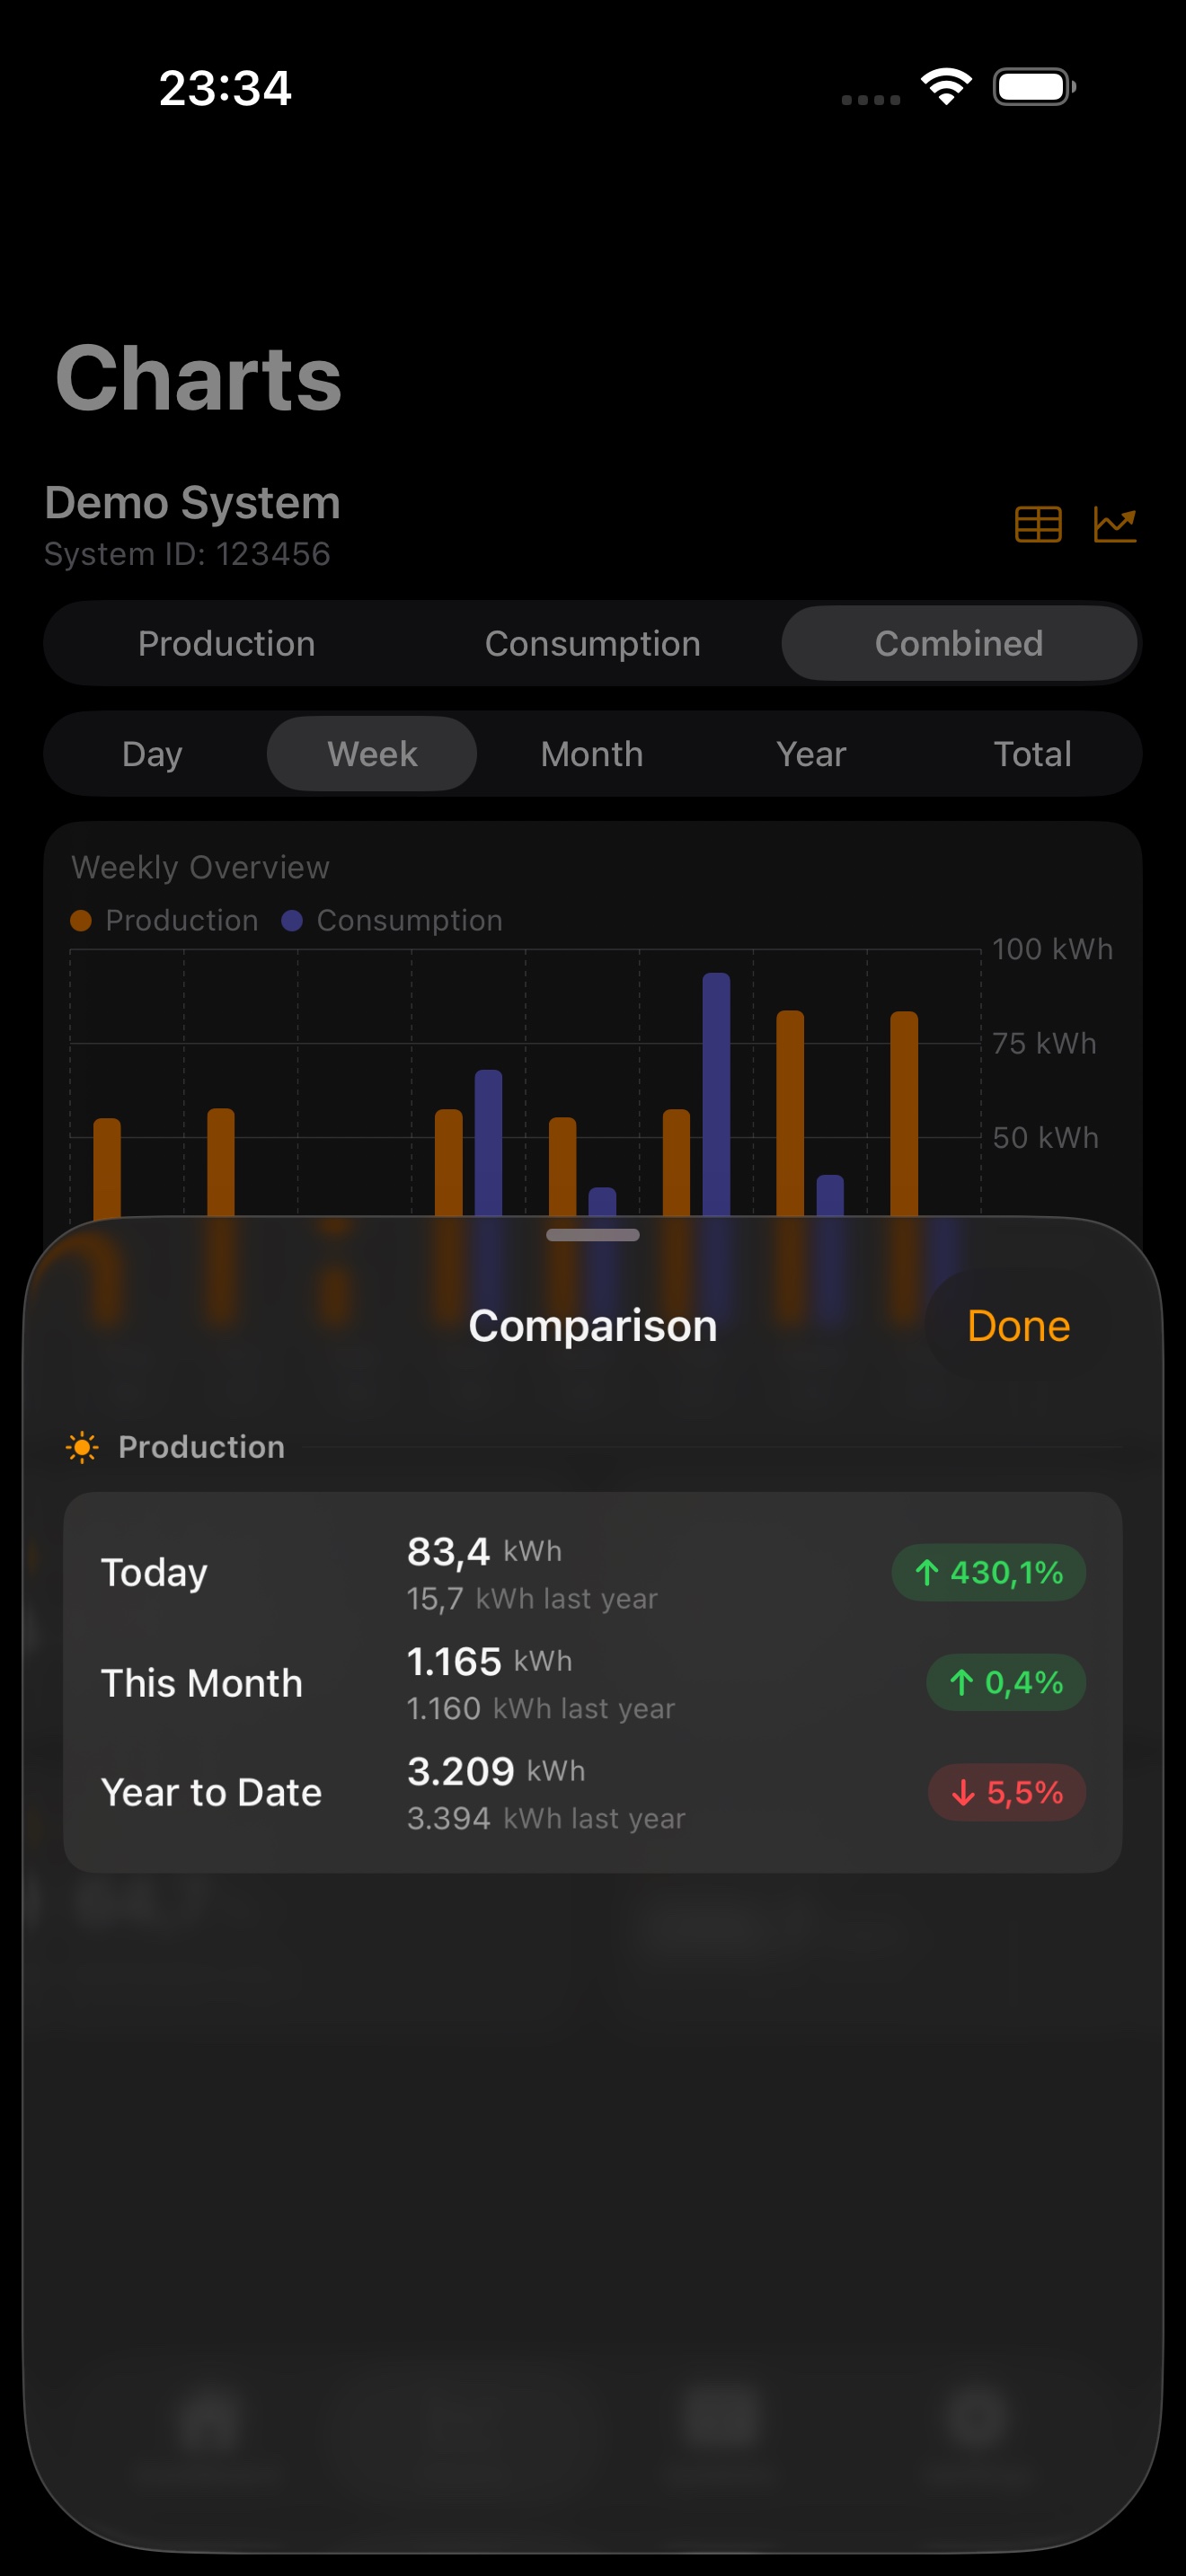
Side-by-side breakdown of Today / This Month / Year-to-Date versus the same periods last year. Export as a one-page PDF.
No account with us needed. Your data stays between you and PVOutput.
Log in to pvoutput.org, go to Settings → API Access, and create a read-only API key. One key works for all your systems.
Open HelioPeak, tap the + button, enter your System ID and API key. Your System ID is in your PVOutput account URL.
That's it. Your complete production history loads automatically. Browse charts, check stats, export to CSV.
HelioPeak is actively developed and shaped by user feedback.
Have a feature request? Let us know →
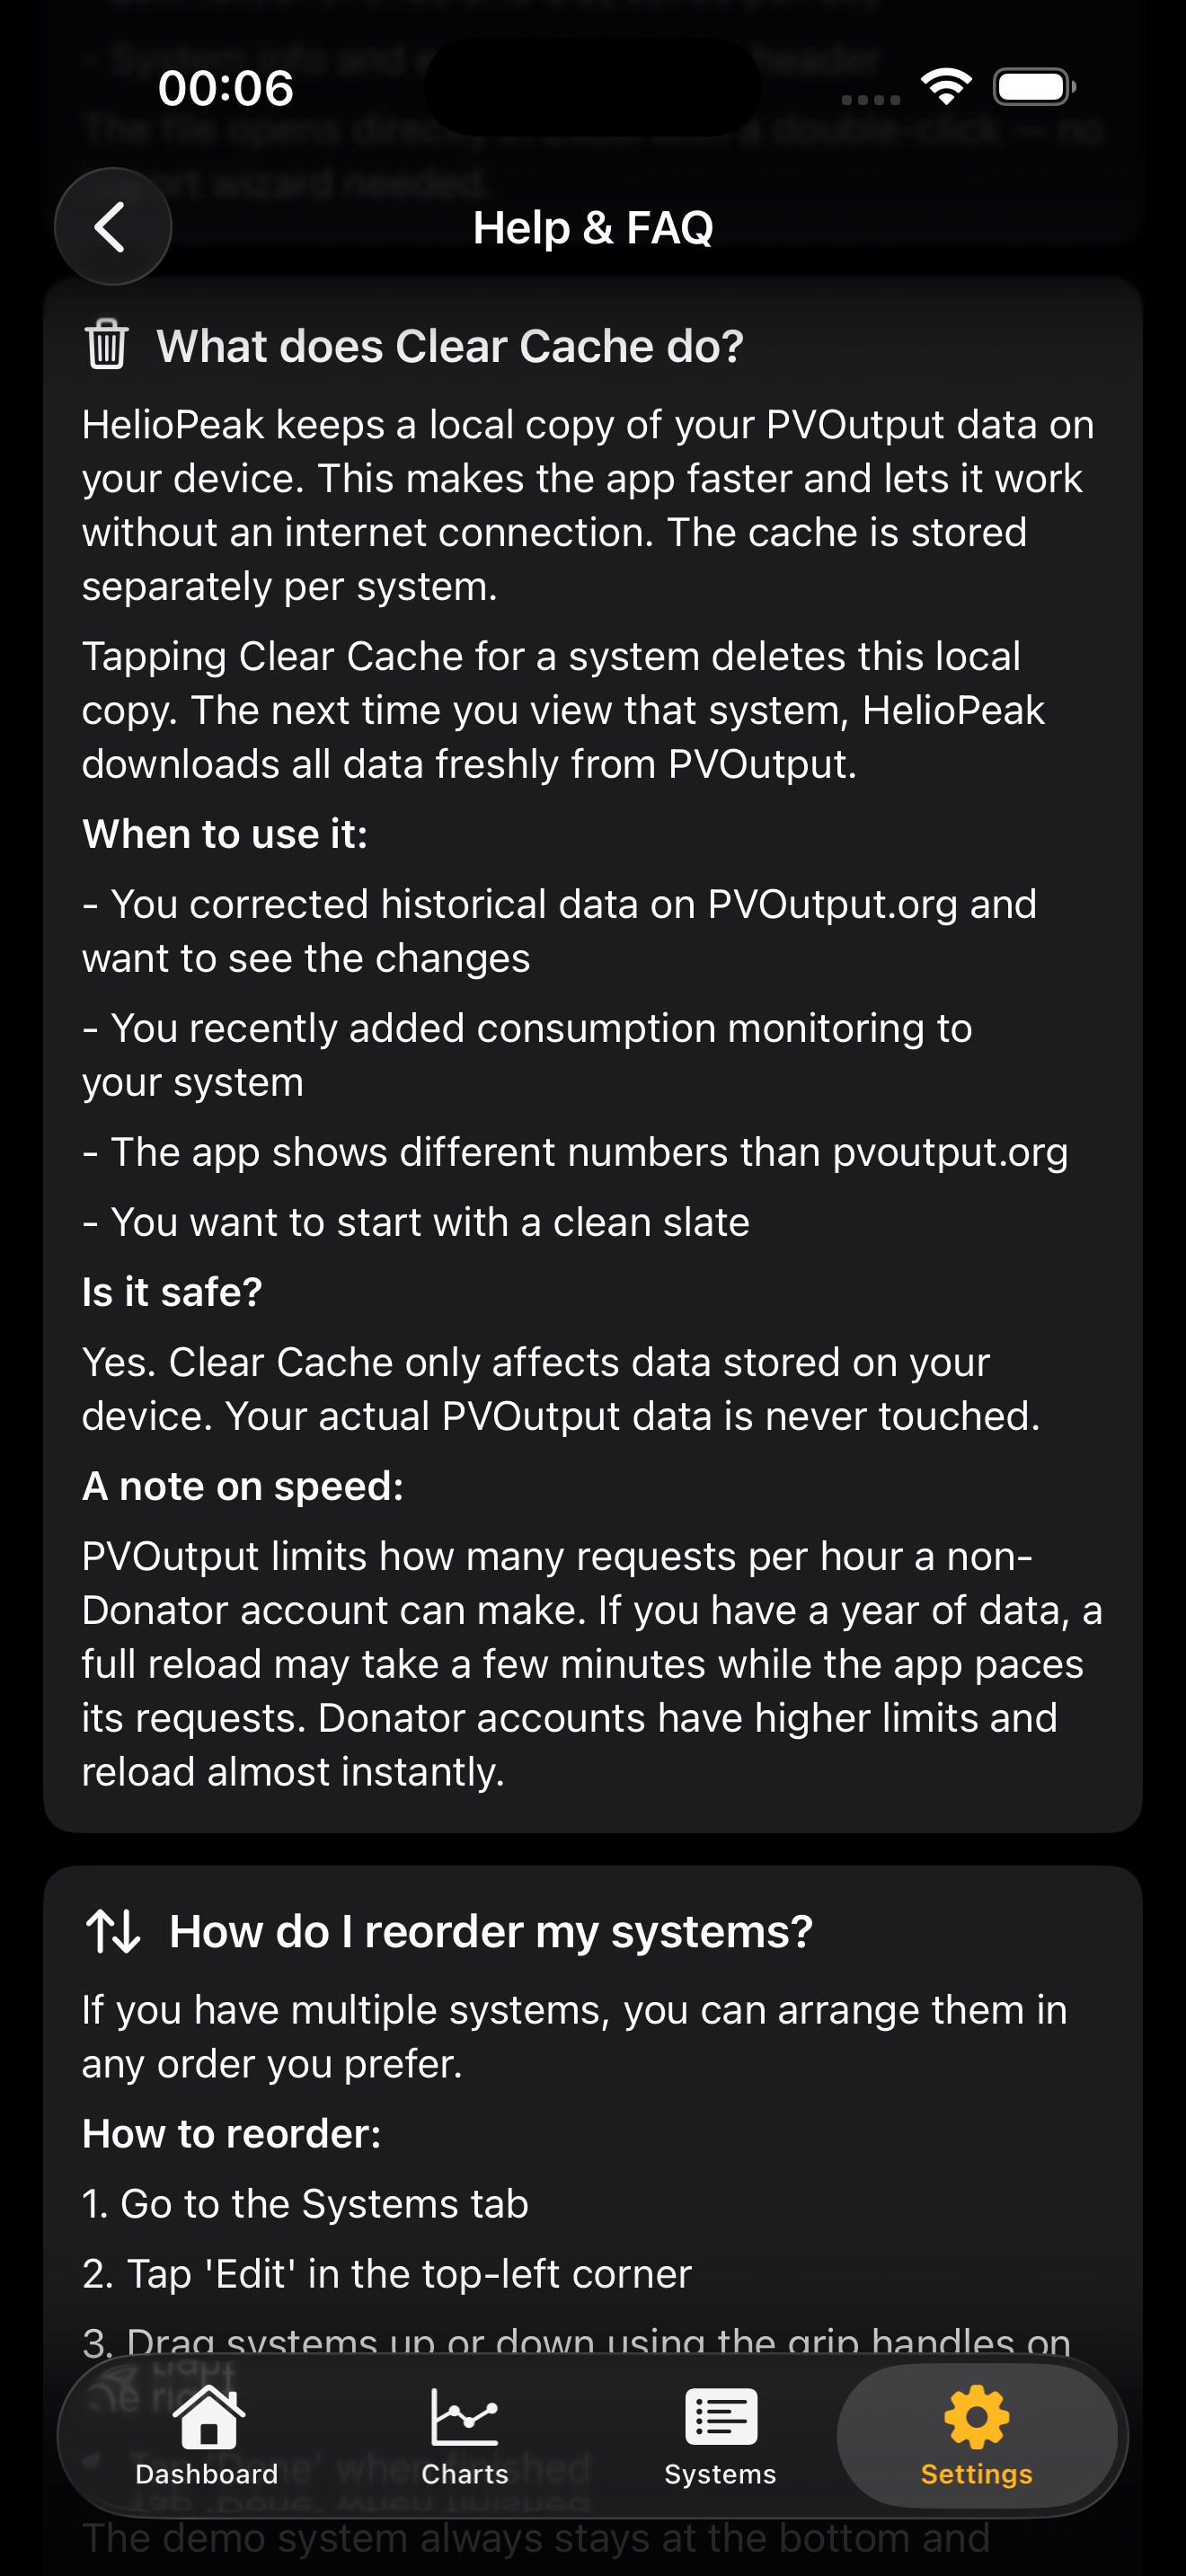
_notes.csv) so each opens cleanly in Excel as its own table. The JSON export adds a notes array at the root of the existing file. Both formats are sorted chronologically with date, text, optional category, and timestamps.Solar monitoring, PVOutput tips, and what we've learned building HelioPeak.
Claude, ChatGPT, Gemini, Google AI Studio, Grok, and Copilot all got the same export. Their answers diverged so much we had to redesign the prompt.
May 10, 2026The dark months, the April-May surprise, the summer plateau, September's quiet excellence, and October's cliff.
May 10, 2026An honest comparison of the four PVOutput iOS apps in 2026, with explicit conflict-of-interest disclosure.
May 4, 2026What HelioPeak is, what it isn't, and the design decisions behind a privacy-first native iOS app for solar monitoring.